

Water resources represent all liquid, solid, and atmospheric water available for ecological functions and human use. While water covers over 70% of Earth’s surface, only 2.5% is freshwater, and nearly 69% of that is locked in polar ice sheets and glaciers. In resource accounting, economists strictly separate stocks (static volumes in deep fossil aquifers and ice caps), flows (active annual precipitation and river runoff), withdrawals (water diverted for agriculture, industry, and municipal supply), and water stress (the ratio of withdrawals to renewable availability). Agriculture accounts for 70% of global water withdrawals. How are global freshwater resources distributed, and where is water stress most critical?
Water is the ultimate limiting factor of terrestrial life and economic activity. A nation can survive without domestic petroleum reserves or copper deposits by trading in international markets, but no civilization can exist without secure access to clean freshwater. Water irrigates the crops that nourish humanity, drives hydroelectric turbines, cools industrial thermal power stations, and sustains every biological biome on Earth.
Table de contenidos
Yet freshwater is distributed with extraordinary spatial inequality. According to the United Nations World Water Development Report, over 2.2 billion people live in water-stressed countries, and roughly 4 billion people experience severe water scarcity for at least one month per year. Compounding this challenge, human usage often blurs the critical distinction between dynamic water flows that renew annually and finite geological groundwater stocks that are being permanently depleted.
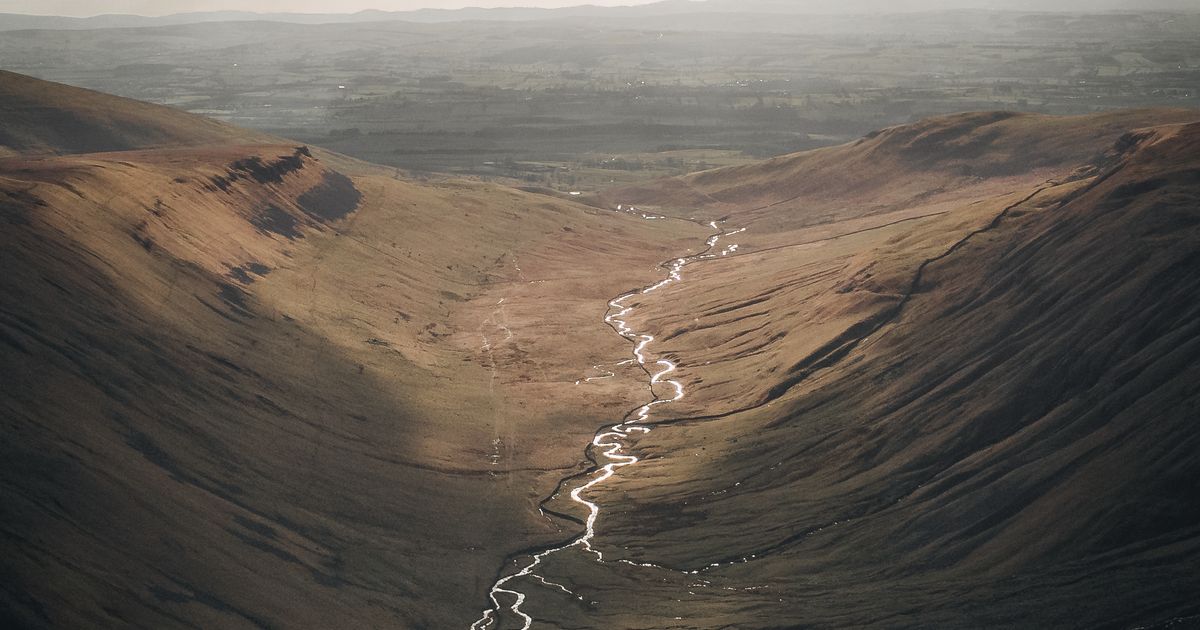
The Global Distribution of Water: Why Freshwater Is Scarce
The total volume of water on Earth is estimated at roughly 1.386 billion cubic kilometers (km³). However, the overwhelming majority is saline oceanic water, leaving only a tiny fraction accessible for human civilization:
| Water Reservoir | Percentage of Total Water | Percentage of Freshwater | Accessibility & Renewal Characteristics |
|---|---|---|---|
| Oceans & Saline Seas | 96.54% | — | Saline; requires energy-intensive thermal or reverse osmosis desalination to become potable. |
| Glaciers & Polar Ice Caps | 1.74% | 68.7% | Concentrated in Antarctica and Greenland; largely inaccessible for direct regional human use; melting into oceans due to climate warming. |
| Groundwater (Fresh) | 0.76% | 30.1% | Subsurface aquifers; provides ~50% of global drinking water and ~40% of agricultural irrigation water. |
| Surface Freshwater (Lakes & Rivers) | 0.007% | 0.3% | Freshwater lakes (0.26%), seasonal wetlands, and river channels (0.006%); the primary accessible dynamic flow for human civilization. |
| Atmospheric Water & Soil Moisture | 0.001% | 0.05% | Water vapor, clouds, and shallow soil moisture that sustains non-irrigated (“green water”) forestry and dryland pastures. |
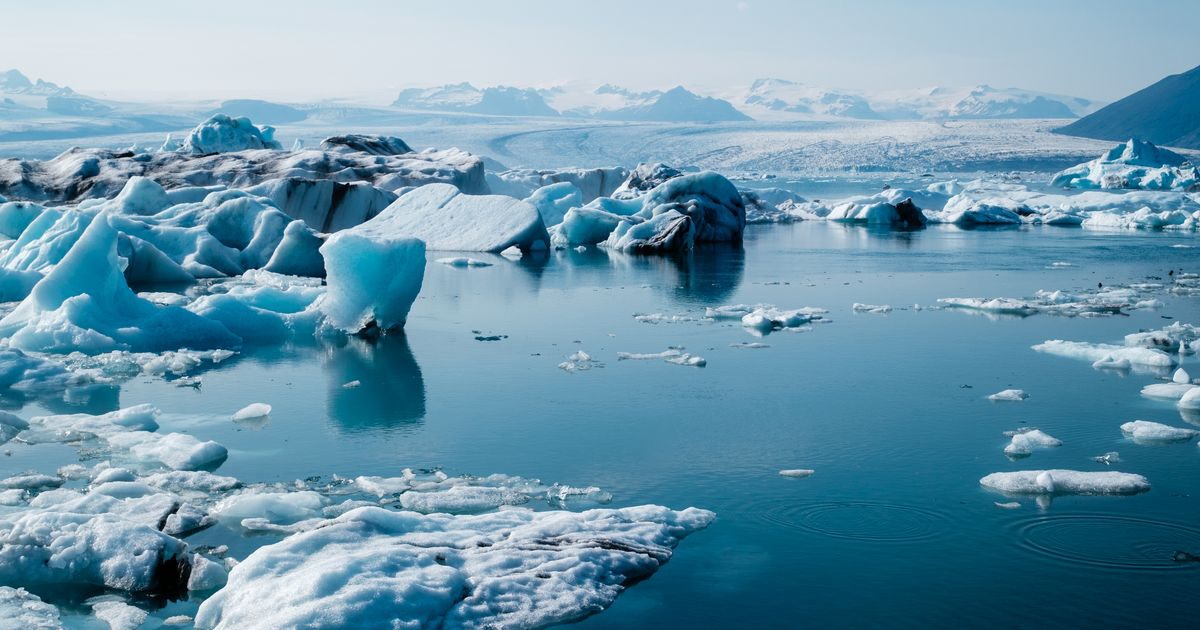
Stocks vs. Flows vs. Withdrawals: The Hydrological Balance Sheet
To manage water sustainably, hydrologists and environmental economists establish a rigorous distinction between four separate metrics:
- Freshwater Stocks: The static, physical volume of water stored in natural reservoirs at any given moment. This includes deep geological aquifers (such as the Nubian Sandstone in North Africa or the deeper zones of the Ogallala in North America), large freshwater lakes (Lake Baikal, Lake Superior), and alpine ice caps. When humanity pumps deep fossil aquifers with zero contemporary recharge, it is treating a non-renewable stock as a flow.
- Renewable Freshwater Flows: The dynamic volume of water moving through the hydrological cycle annually through evaporation, precipitation, and river runoff. According to FAO AQUASTAT, global internal renewable water resources (IRWR) total roughly 42,000 to 45,000 km³ per year. This flow constitutes humanity’s true sustainable water budget.
- Water Withdrawals: The total gross volume of water diverted or pumped from surface sources or aquifers for agricultural, industrial, or domestic purposes. Globally, human society withdraws approximately 4,000 km³ of freshwater annually—about 10% of total renewable continental runoff.
- Consumptive Water Use: The portion of withdrawn water that is not returned to the local watershed because it is evaporated, transpired by crops, incorporated into manufactured products, or consumed by livestock. Agriculture accounts for over 80% of total consumptive use.
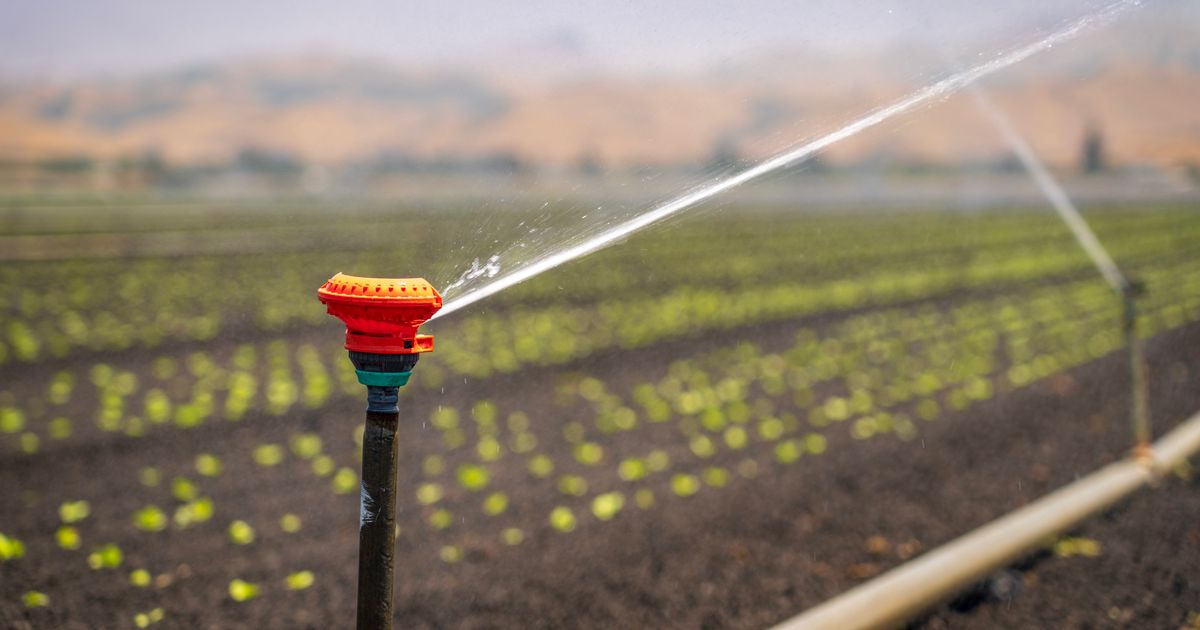
Water Stress and Scarcity: Measuring the Pressure on River Basins
Under United Nations Sustainable Development Goal (SDG) indicator 6.4.2, water stress is formally defined as the ratio between total freshwater withdrawn by all major sectors and total renewable freshwater resources available, after accounting for environmental flow requirements (the water river ecosystems require to survive):
- Low Water Stress (< 25%): River basins where human withdrawals do not threaten ecological balance or dry-season municipal needs. Examples include the Amazon Basin, Scandinavia, and Canada.
- Medium to High Water Stress (25% to 70%): Regions where intensive irrigation and urban centers create recurring seasonal deficits, such as the Mediterranean basin and sections of the western United States.
- Critical Water Stress (> 70% to > 100%): Basins where withdrawals exceed natural annual replenishment, requiring severe groundwater over-drafting or desalination. Countries across the Middle East, North Africa, and Central Asia routinely exceed 100% water stress, mining fossil aquifers to sustain desert agriculture and urban centers.
Countries with the Largest Renewable Freshwater Resources
Total renewable water wealth is concentrated in nations blessed with vast river networks and tropical or temperate precipitation belts:
- Brazil: The world’s freshwater giant, boasting over 8,230 km³ of renewable water per year (~12% of the global total), driven by the Amazon, Paraná, and São Francisco river basins.
- Russia: Holds roughly 4,500 km³ annually, with massive Siberian rivers (Yenisey, Lena, Ob) and Lake Baikal, which alone contains 20% of Earth’s unfrozen surface freshwater.
- Canada: Endowed with roughly 2,900 km³ per year, featuring thousands of glaciated lakes and extensive sub-arctic river watersheds.
- United States: Possesses roughly 2,800 km³ annually, anchored by the Mississippi-Missouri river basin and the Laurentian Great Lakes.
- Colombia: One of the world’s most hydrologically dense nations, generating over 2,100 km³ of water annually due to intense Pacific and Andean rainfall patterns.
- China: Holds roughly 2,800 km³ per year, but faces acute geographic asymmetry, with abundant water in the southern Yangtze basin and severe scarcity in the northern Yellow River basin.
Authoritative Data Sources Used
All hydrological volumes, withdrawal shares, and stress percentages in this report are sourced from primary international water monitoring bodies:
- Food and Agriculture Organization (FAO): AQUASTAT Global Information System on Water and Agriculture.
- UNESCO / UN-Water: United Nations World Water Development Report (WWDR).
- World Resources Institute (WRI): Aqueduct Water Risk Atlas.
- United States Geological Survey (USGS): Water Resources Mission Area.
- To review our editorial and statistical standards, visit our Research Methodology and Official Sources.

Leave a Reply