
Categories:

Sustainable Development in Argentina: Trends and Key Figures

Published on

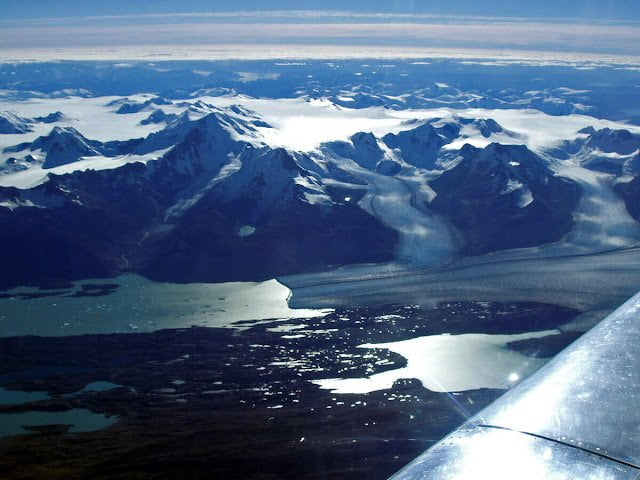
SantaCruz Upsala P2140135b

Sustainable development in Argentina shows clear strengths and clear shortcomings. How does the country measure up? It has great biodiversity, and its protected areas cover 8.8% of its land area, but fossil fuels still generated 58% of its electricity in 2025, and it ranked 81st in the 2024 Environmental Performance Index.

To analyze sustainable development in Argentina, it is useful to look at the country’s current situation and, above all, at trends in conservation, energy use, consumption, public policy and other areas that show how the country is developing with a view to guaranteeing future generations of Argentines the natural resources they need to survive.
Argentina is home to Iguazú Falls, chosen in 2011 as one of the New7Wonders of Nature.

Argentina has an enormous diversity of wildlife and plants thanks to its size and its range of climates, which are shaped by factors as varied as latitude, altitude and soil conditions. This diversity gives the country many native species, such as the maned wolf, the Pampas fox, the tapeti, the huemul, the pudu and the pink fairy armadillo, among others.

Argentina has three very different geographic zones:
  • Plains in the central and northern part of the country, with areas of dense vegetation as well as extensive palm groves and grasslands.
  • Plateaus in the south, with tablelands and hill ranges (Patagonia).
  • Mountains in the west, with mountainous and hilly terrain and sparse vegetation.

Natural parks of Argentina


Upsala Glacier in Santa Cruz, one of Argentina's natural parks
 
In this area of sustainable development, Argentina has an extensive national system of protected areas. As of 2024, protected areas covered 8.8% of its land area and 12.0% of its territorial waters (marine protected areas), according to the World Bank (2024).
 
The largest national parks on land are Los Glaciares National Park (726,927 ha), Nahuel Huapi National Park (712,160 ha) and Lanín National Park (412,000 ha).

Trends in sustainable development in Argentina

To understand how economic development and environmental degradation have unfolded in Argentina in recent years, it helps to look at a few trends and indicators that show how significant the country’s efforts to achieve sustainable development have been.

Per capita carbon dioxide emissions in Argentina and other countries


Chart of per capita carbon dioxide emissions in Argentina and other countries
Argentina’s per capita carbon dioxide emissions rose from 3.6 t in 1980 to a peak of 4.5 t in 2013 and then fell to about 4.0 t in 2024, according to World Bank data. In 2024 they were still among the highest in South America, behind only Guyana and Suriname.
 
Even so, that level is well above the Latin American and Caribbean average of 2.7 t per capita (World Bank, 2024).

Electricity from fossil fuels in Argentina and other countries


Chart of the share of electricity supply from fossil fuels in Argentina and other countries
 
Fossil fuels, mainly natural gas, still generate most of Argentina’s electricity: 58% in 2025, down from a peak of 73% in 2016. Renewable energy sources supplied 35% that year (hydropower 17%, wind 12% and solar 3%), up from 21% in 2016, and nuclear power 7% (Ember).
 
Biodiversity and sustainable development in Argentina

Some figures on sustainable development in Argentina

Argentina’s Environmental Performance Index


The Environmental Performance Index (EPI) rates how well countries perform in two important policy areas: protecting human health from environmental harm and protecting ecosystems, both of which are fundamental to sustainable development.
 
According to the 2024 Environmental Performance Index, Argentina ranks 81st out of 180 countries, with a score of 47.0. In this index, Argentina stands out in agriculture (2nd place), while it lags behind in biodiversity and habitat (135th) and waste management (123rd).

Human Development Index (HDI) of Argentina and other countries


Chart of the Human Development Index (HDI) of Argentina and other countries
 
In 2023, Argentina ranked 47th on the Human Development Index, with a value of 0.865, placing it in the very high human development group, behind Chile (45th). However, it outranks most Latin American countries, such as Colombia (83rd) and Mexico (81st). Its quality of life is slightly lower than that of developed countries.

Ecological footprint and biocapacity per person in Argentina


Chart of ecological footprint and biocapacity per person in Argentina

According to Global Footprint Network data as of 2017, the individual ecological footprint of Argentines had remained stable over the previous decades, while the country’s biocapacity per person had declined considerably.

Broadly speaking, then, given the country’s large biocapacity, its economic activities can be considered sustainable, at least in the short term.

Argentina’s ecological footprint compared with other countries in the region


Chart comparing Argentina's ecological footprint with other countries in the region

The ecological footprint measures how much biologically productive land and water area an individual or population needs to produce the resources it consumes and absorb the waste it generates. It is measured in global hectares (gha).

After Chile, Argentina is one of the Latin American countries with the largest ecological footprint.

Sources:
Global Footprint Network
Google Public Data
HDI
Environmental Performance Index

Last updated: September 26, 2026

Share this resource:

Juan David Montoya

Written and reviewed by

Juan David Montoya

Economist from the Universidad de Antioquia (Medellín, Colombia), covering the environment and sustainable development since 2013. The work here begins with hands-on research in the databases of the major international research institutions — the World Bank, FAO, the United States Geological Survey (USGS), the United Nations and the OECD — the source of every indicator published on this site, each one cross-checked. The aim is to turn that data into a simple, visual format: tables, maps and visualizations that make each country's environmental situation clear at a glance.

How this content is researched and updated: editorial standards and methodology · report an error

Comments

Leave a Reply

Your email address will not be published. Required fields are marked *

Latest articles: