

Energy resources encompass all primary physical and chemical sources that can be converted into usable heat, mechanical motion, and electricity. In energy systems analysis, experts strictly separate resource supply (the total raw energy extracted, such as barrels of crude or solar irradiance), generation capacity (the maximum potential power output of installed equipment, measured in gigawatts, GW), and actual generation (the real electricity delivered over time, measured in terawatt-hours, TWh). While fossil fuels still account for ~80% of total primary energy supply, clean sources reached a record 40.9% of global electricity generation in 2024. How are energy resources classified, and how does the energy transition bridge primary supply with end-use power?
Energy is the master resource. Without energy, no other natural resource can be extracted, refined, manufactured, or transported. Every agricultural combine, water desalination plant, server farm, and metallurgical smelter is fundamentally a machine for transforming primary energy into economic utility. Consequently, access to dependable energy resources has shaped geopolitical power, technological revolutions, and standard-of-living metrics for centuries.
Table de contenidos
However, public discourse often conflates three entirely different metrics: how much raw energy exists in nature (resource supply), how much machinery is built to harness it (installed capacity), and how much usable power actually flows into power grids (actual electricity generation). Clarifying these distinctions is critical for understanding the global transition from carbon-intensive fossil hydrocarbons to clean, renewable alternatives.
Classification of Energy Resources: Primary vs. Secondary, Renewable vs. Non-Renewable
Energy analysts categorize resources using two foundational dimensions:
1. Primary Energy vs. Secondary Energy
Primary energy refers to natural energy sources extracted directly from nature before undergoing any technical conversion. Examples include crude petroleum pumped from a reservoir, run-of-mine coal, raw natural gas, radiant sunlight, kinetic wind, and uranium ore. Secondary energy is an energy carrier created by converting primary energy into forms that end-users can easily utilize, most notably electricity, refined gasoline, diesel, and green hydrogen.
2. Renewable vs. Non-Renewable Energy Resources
As explored in our comparative analysis of renewable vs. non-renewable resources:
- Non-Renewable Energy: Finite geological stocks formed over hundreds of millions of years. Crucially, burning fossil fuels releases ancient trapped carbon into the active biosphere:
- Crude Oil: Powers over 90% of global transport and serves as feedstock for petrochemical plastics and fertilizers.
- Coal: The most carbon-intensive fossil fuel, still producing over 35% of the world’s electricity, dominated by consumption in China and India.
- Natural Gas (Methane): Emits roughly 50% less CO₂ per unit of electricity than coal, functioning widely as a flexible baseload and peaking fuel.
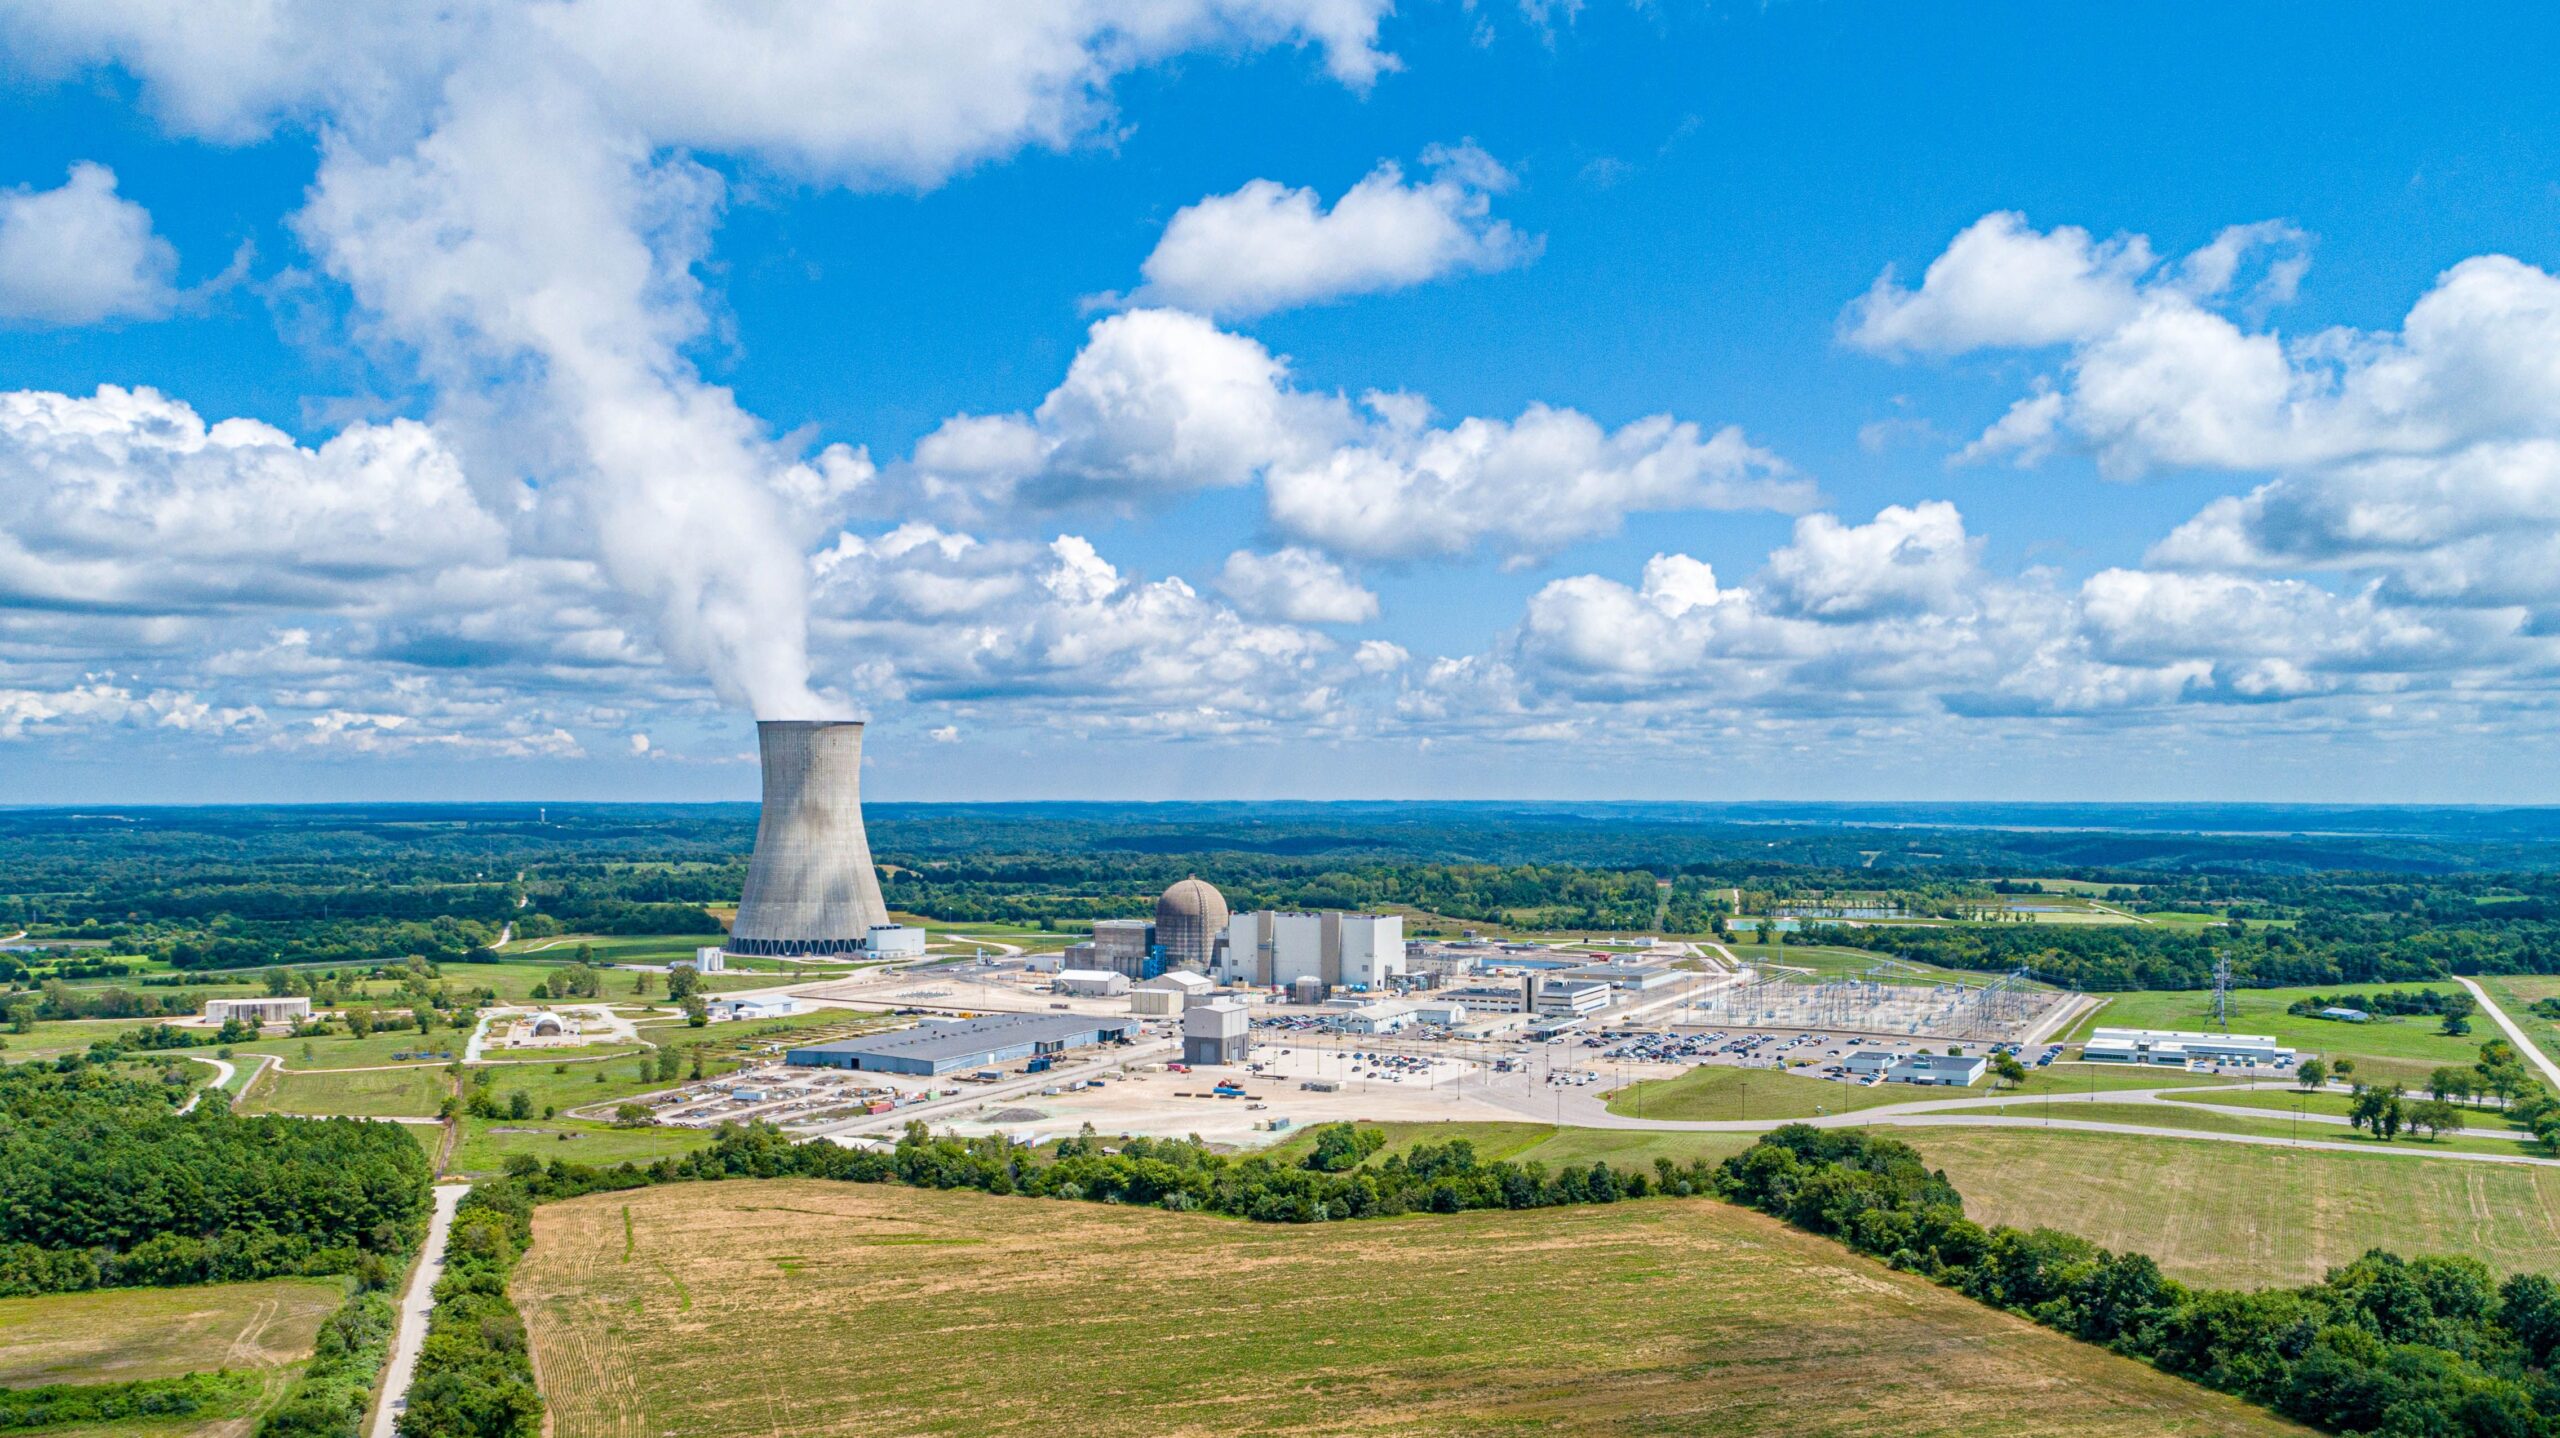
- Uranium / Nuclear Power: Generates ~9% of global electricity through nuclear fission with near-zero direct greenhouse emissions.
- Renewable Energy: Naturally replenished flows and cycles that provide continuous power without exhausting planetary stocks:
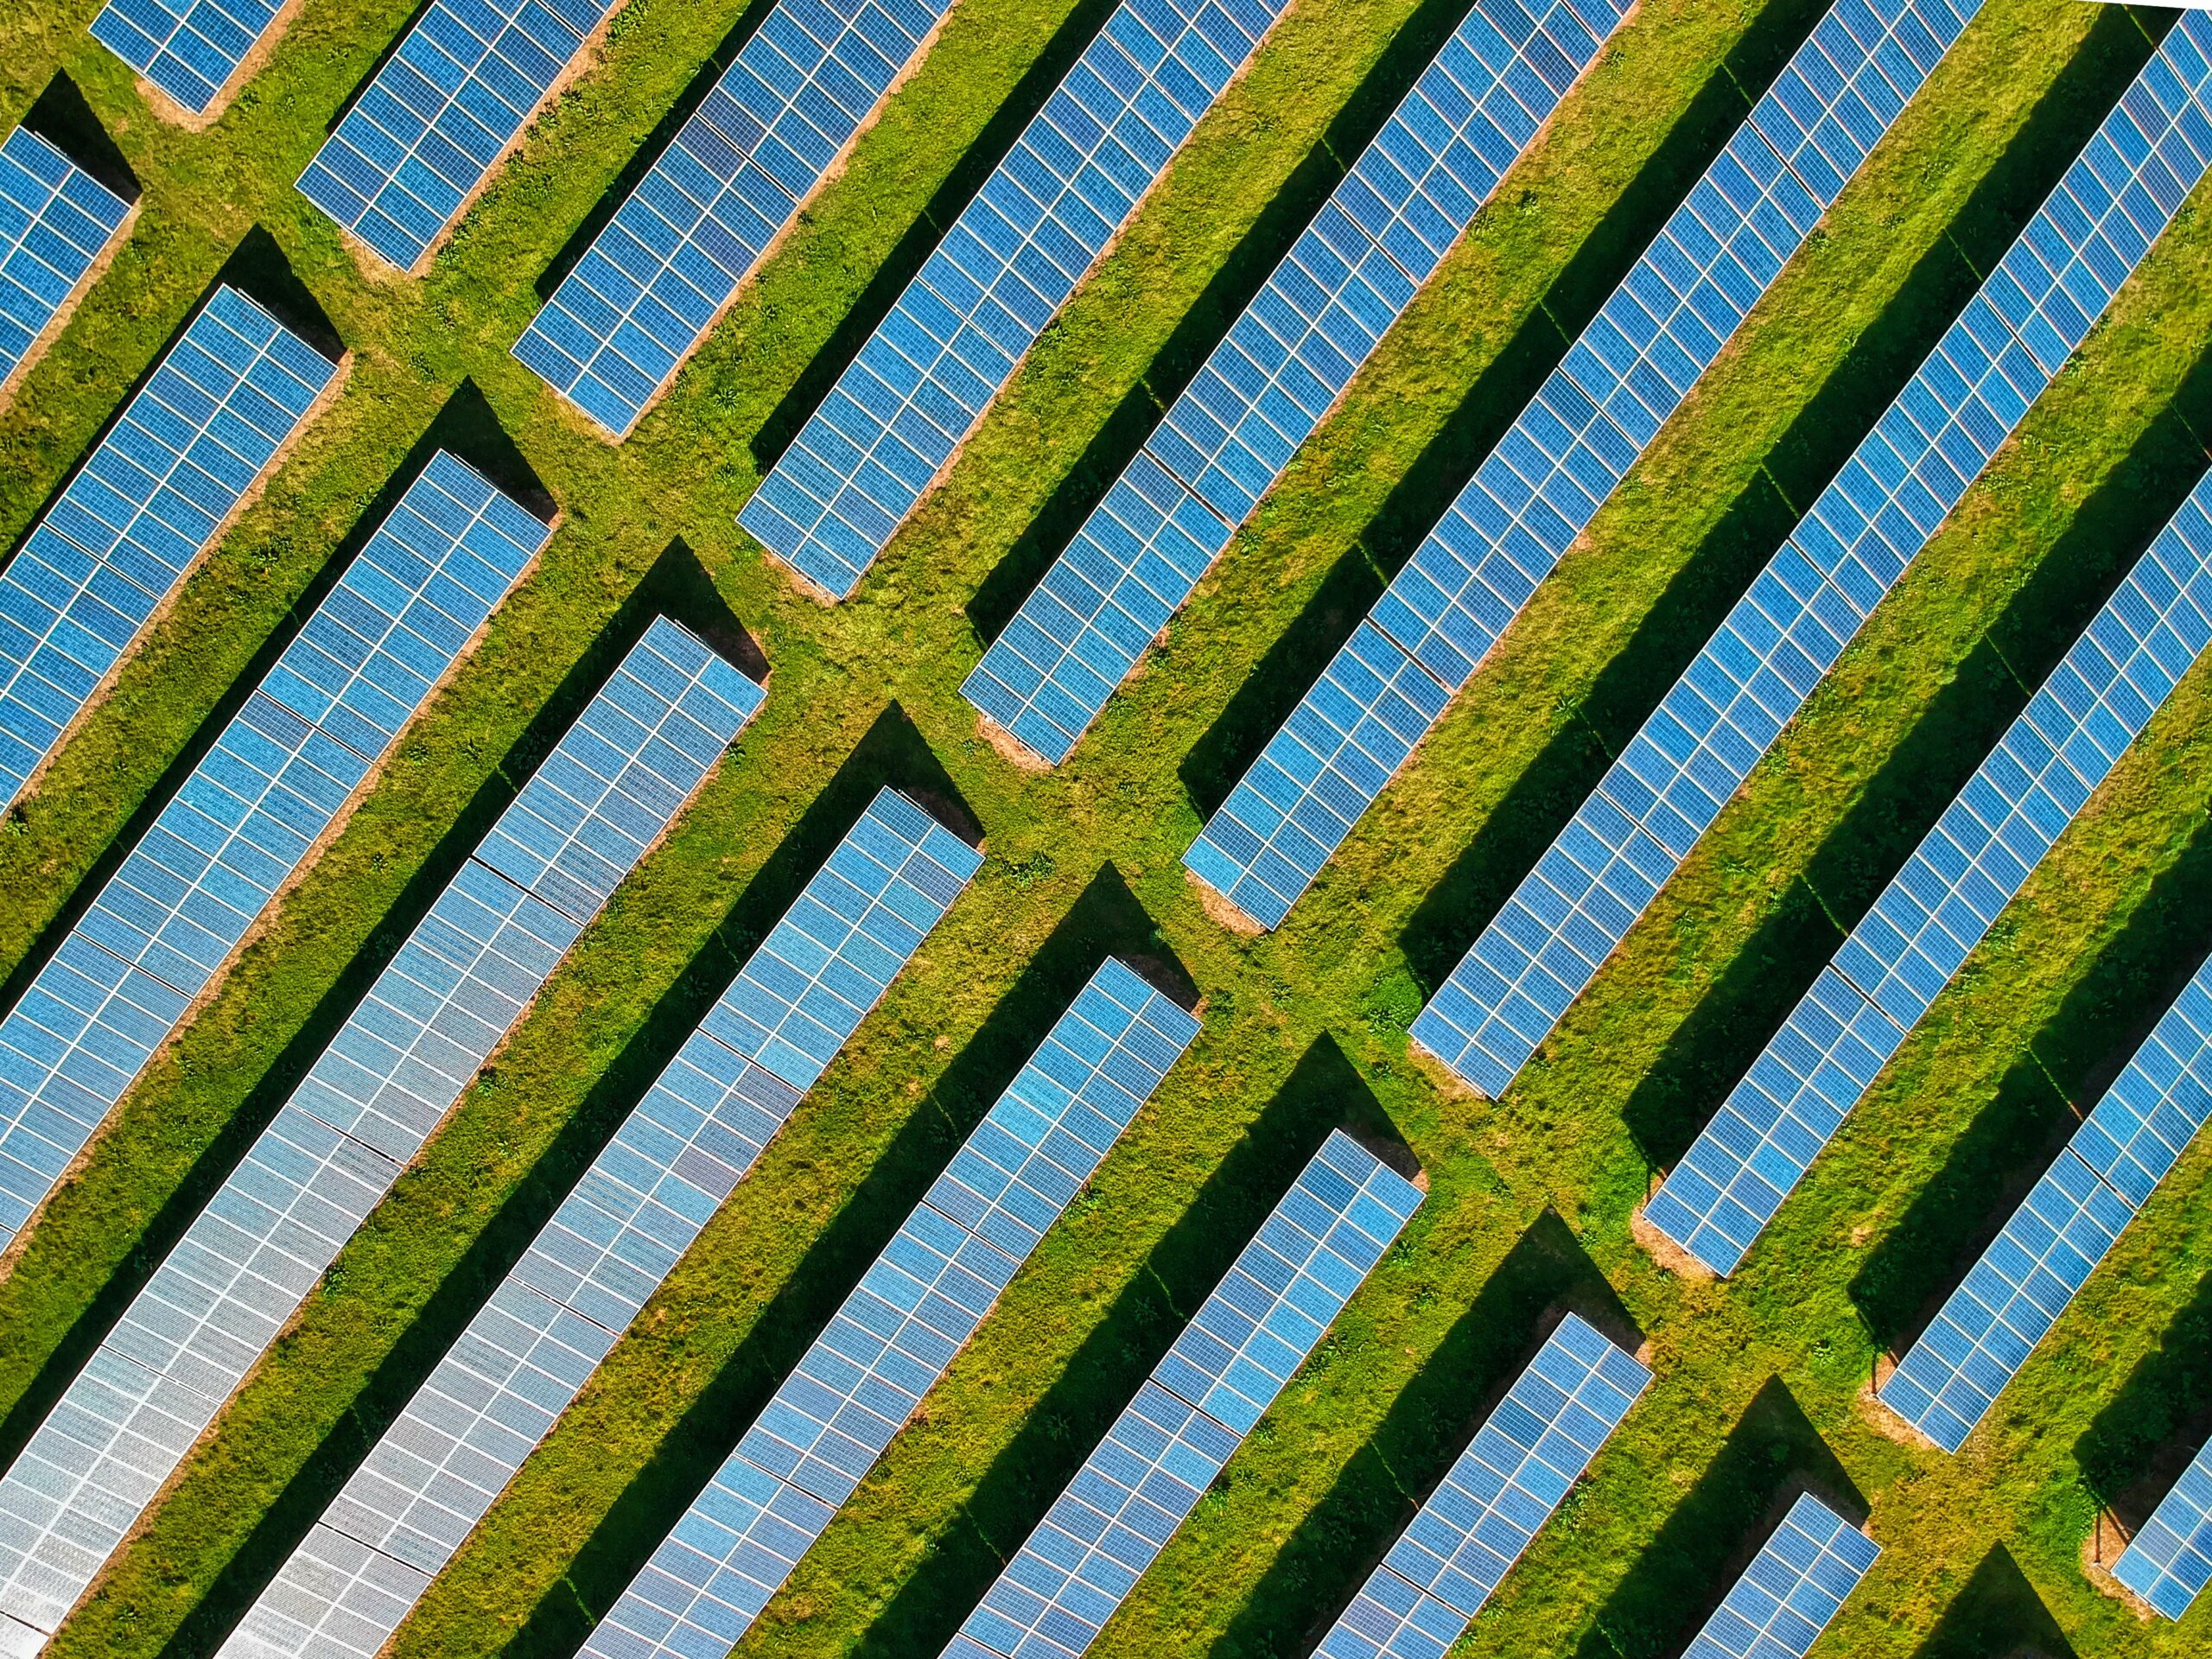
- Solar Energy: Photovoltaic cells and concentrated solar thermal plants.
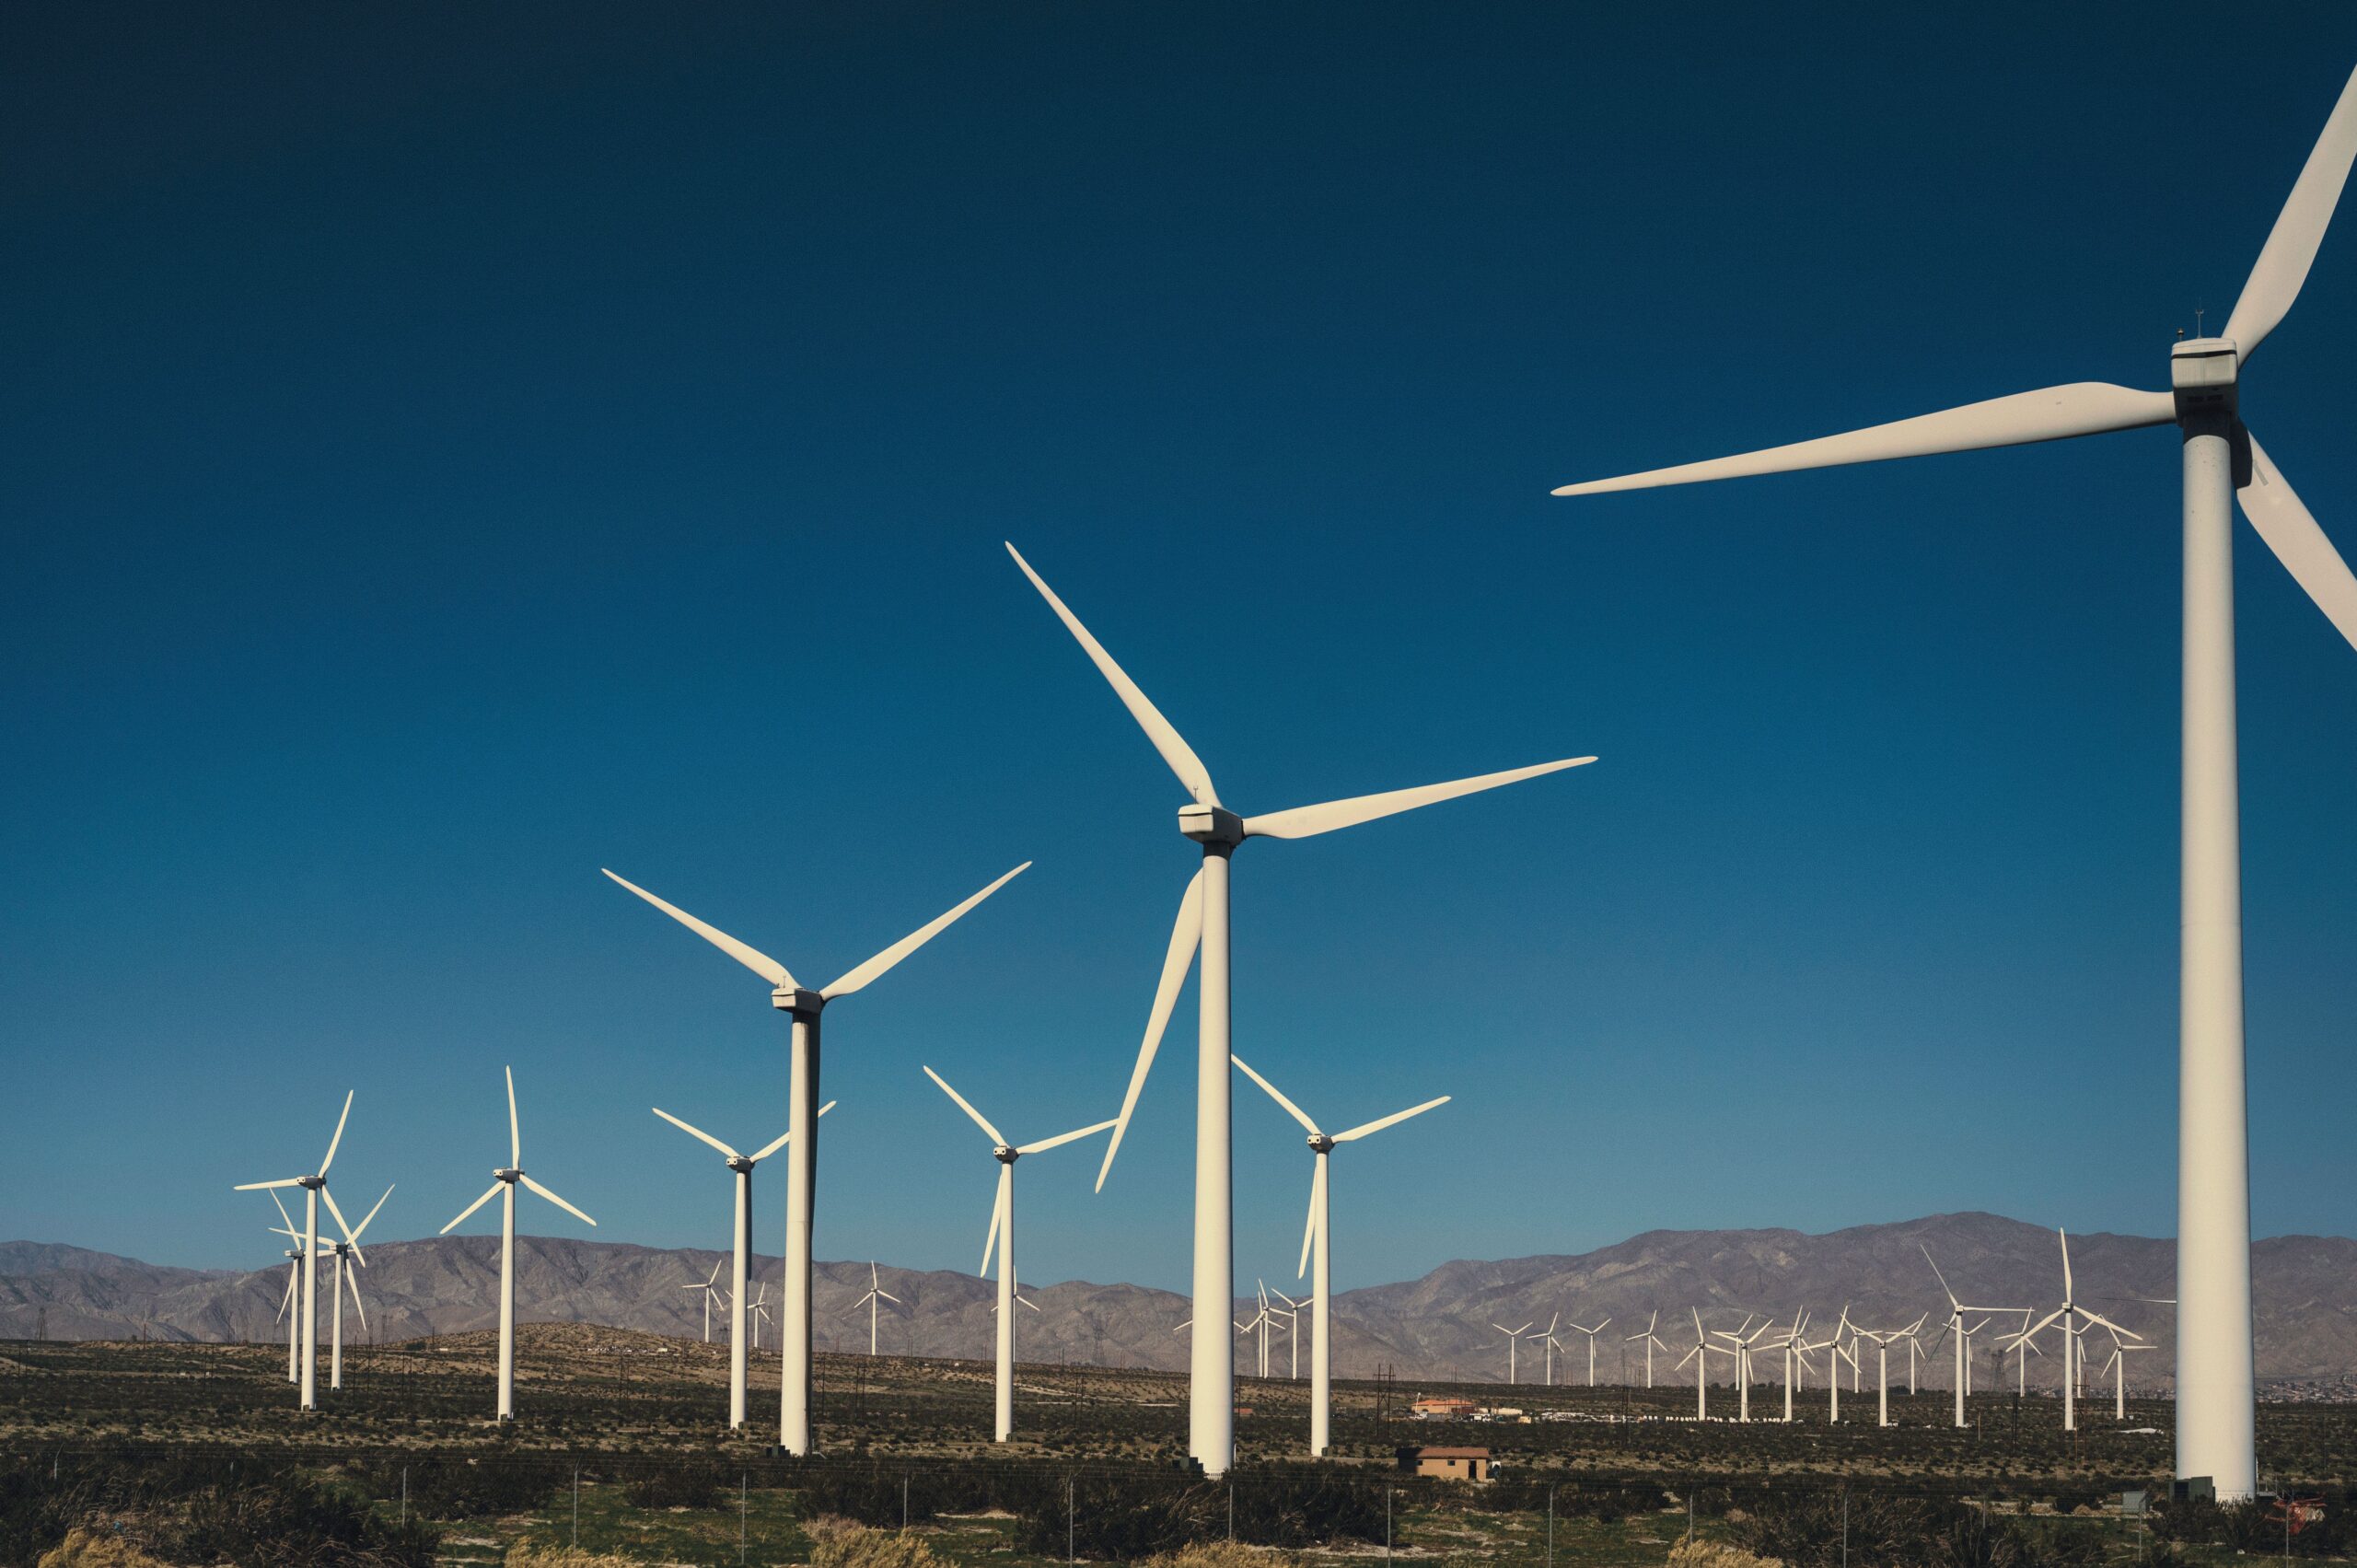
- Wind Energy: Onshore and offshore wind turbine arrays.
- Hydropower: Run-of-river and reservoir systems, supplying over 14% of global power.
- Geothermal & Bioenergy: Earth’s internal heat and sustainably harvested agricultural/forestry biomass.
The Crucial Distinction: Resource Supply vs. Generation Capacity vs. Actual Generation
One of the most persistent misunderstandings in energy policy is failing to differentiate between the physical resource, the installed machinery, and the electricity delivered to homes and factories:
| Metric | Technical Definition | Standard Units | Concrete Illustrative Example |
|---|---|---|---|
| 1. Primary Resource Supply | The total raw energy available in nature or extracted from geological and environmental reservoirs. | Exajoules (EJ), Millions of Barrels of Oil Equivalent (Mboe), Solar Insolation (kWh/m²/day) | The Sahara Desert receives enough raw solar irradiance in six hours to power the entire global economy for a full year. That is the resource supply, but it produces zero electricity until captured by hardware. |
| 2. Installed Generation Capacity | The maximum electrical power output that installed energy equipment (generators, turbines, solar panels) can produce under ideal peak operating conditions. | Megawatts (MW), Gigawatts (GW) | A utility installs a 1,000 MW (1 GW) solar photovoltaic farm. Its nameplate capacity is 1 GW, but it only generates at that maximum during peak sunny midday hours. |
| 3. Actual Electricity Generation | The real, physical volume of electrical energy produced and delivered to the electrical grid over a defined period (typically one year). | Kilowatt-hours (kWh), Terawatt-hours (TWh) | Because of night hours and clouds, that 1 GW solar farm operates at a ~25% capacity factor, delivering roughly 2,190 GWh (2.19 TWh) of actual electricity per year. A 1 GW nuclear plant, operating at a 90% capacity factor, would deliver 7,880 GWh—nearly four times more electricity from the same capacity figure. |

The Global Energy Matrix: Total Supply vs. The Electricity Sector
To evaluate the progress of the energy transition, analysts examine two distinct balance sheets compiled by the International Energy Agency (IEA) and think tank Ember:
- Total Primary Energy Supply (TPES): Across all human activities—including international shipping, aviation, long-haul trucking, steelmaking, and residential space heating—fossil fuels (petroleum, coal, and gas) still account for roughly 80% of total energy consumed globally. Decarbonizing heavy industrial heat and transport requires massive electrification and clean hydrogen feedstocks.
- The Global Electricity Sector: Electricity is decarbonizing much faster than total energy. In 2024, clean power sources generated 40.9% of global electricity (hydropower 14.2%, nuclear 9.1%, wind 7.8%, and solar 5.5%), while fossil fuels generated 59.1%. Global annual solar additions alone exceeded 440 GW in 2023 and surpassed 500 GW in 2024.
Authoritative Data Sources Used
All production volumes, capacity statistics, and generation data in this guide are derived from primary official publications:
- International Energy Agency (IEA): World Energy Outlook and Global Energy & CO₂ Data Browser.
- Ember Climate: Global Electricity Review (Annual).
- Energy Institute (EI): Statistical Review of World Energy.
- International Renewable Energy Agency (IRENA): Renewable Capacity Statistics.
- To review our editorial verification protocols, see our Research Methodology and Official Sources.

Leave a Reply