

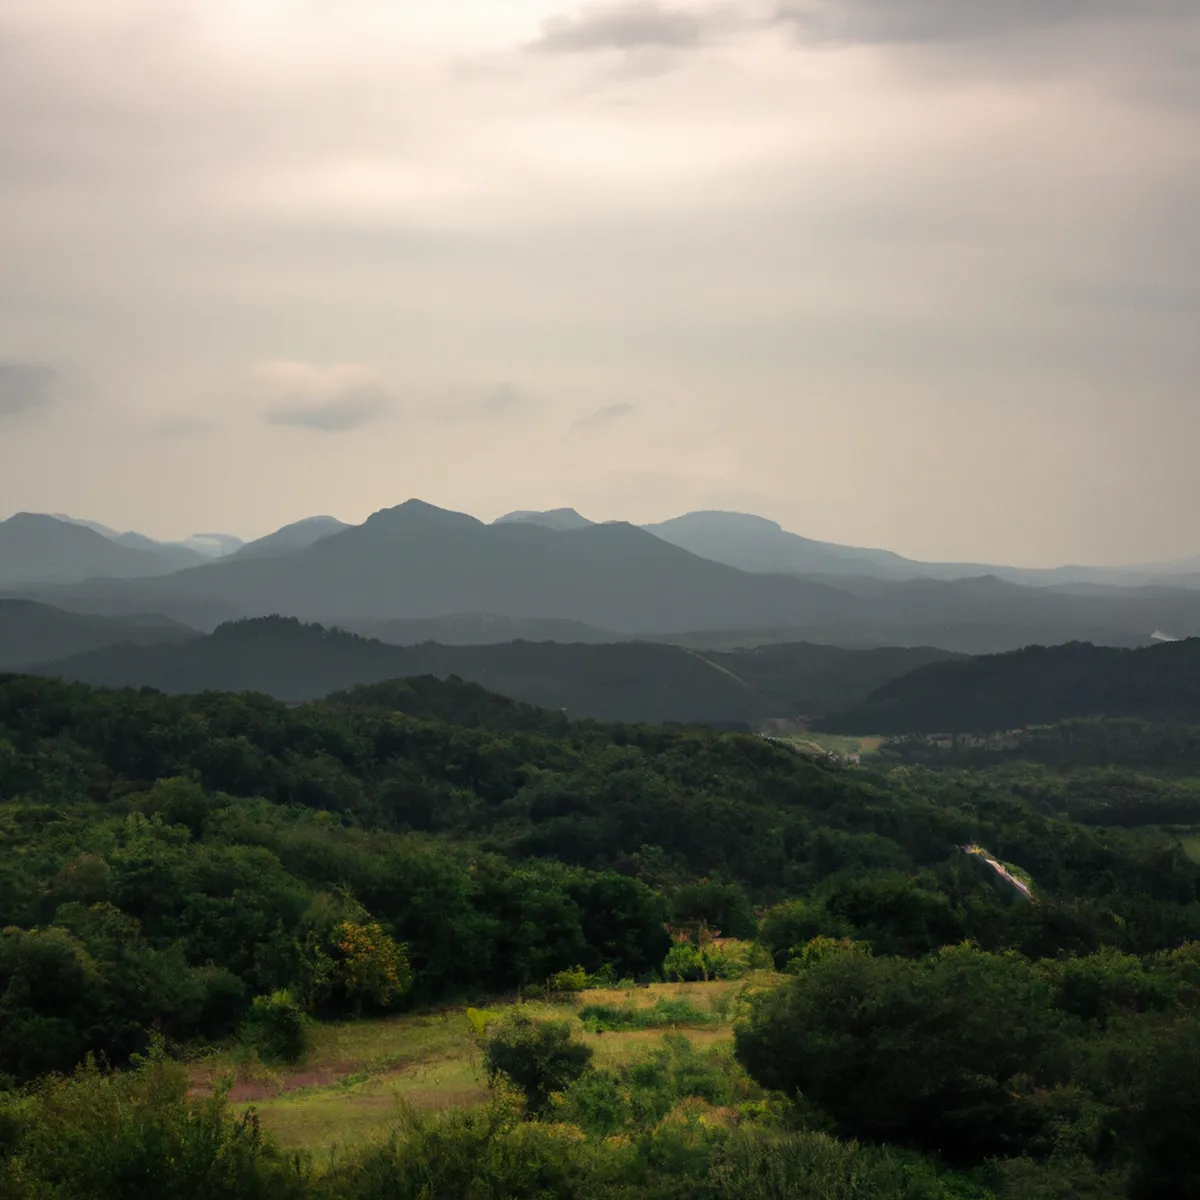
South Korea’s natural resources include metallic minerals such as iron ore, gold, silver, copper, zinc and tungsten, along with coal, with a reserve of 359,353,060 short tons (2023). It holds 68.7 km³ of fresh water and forests covering 64.1% of the territory. Which natural resources in South Korea matter most?
South Korea, on the Korean peninsula, has a rich variety of natural resources. These include forests, rivers, mountains and coastline, which together form a diverse, balanced ecosystem.
Table de contenidos
As a result, the country has a range of mineral resources, such as iron ore, coal and oil. It also has a wide variety of animal and plant species.
What are the natural resources of South Korea, and what is their weight in the world? What natural wealth does the country hold? Which minerals does it have, and where does it sit in the world rankings? How is land used, and how well protected is biodiversity in the country?
Natural Resources
Natural resources are materials or energy sources provided by or found on Earth that are useful to humans. Every product we manufacture is made up of natural resources.
- Renewable resources: these can be restored by natural processes faster than the rate at which they are consumed. Examples include solar radiation, wind, hydroelectric power, water when used properly, and plant and animal life.
- Non-renewable resources: once extracted, these are depleted and cannot regenerate. Examples include hydrocarbons, metals and minerals.
Examples of South Korea’s main natural resources
South Korea’s natural economy
How much natural resource rents weigh, and the state of the territory that produces them.
| Total natural resource rents | 0.0% of GDP2021 |
|---|---|
| Capture fisheries | 1,273,391 t per year2024 |
| Forest cover | 64.1% of the territory2023 |
| Agricultural area | 16.1% of the territory2023 |
| Resource | Reserves / Production | Source |
|---|---|---|
| Coal reserves | 359,353,060 short tons (2023) | EIA |
| Fresh water | 68.7 km³; 73rd worldwide | FAO |
| Forest area | 64.1% of the territory (62,570 km²) | World Bank |
| Environmental performance (EPI) | 50.6; 58th | EPI 2024 (Yale) |
| Birds | 420 species (2023) | Mongabay |
Examples of South Korea’s mineral resources
South Korea holds a variety of both metallic and non-metallic natural resources. The metallic resources include gold, silver, copper, lead, zinc, iron ore, manganese, tungsten, molybdenite, tin, bismuth, antimony and rare earth elements, among others. The non-metallic resources include limestone, dolomite, quartz sand, quartzite, serpentine, feldspar, kaolinite, graphite, talc, pyrophyllite, diatomite, asbestos, fluorite, mica, illite (sericite) and andalusite, among others.
South Korea holds a reserve of coal of 359,353,060 short tons (about 326 million tonnes) according to 2023 data, per the U.S. Energy Information Administration (EIA). The main producing region for this resource in South Korea is Gangwon Province, on the country’s east coast.
Water resources of South Korea
South Korea holds a freshwater reserve of 68.7 km³, placing it seventy-third (73rd) in the world ranking. This Asian country has important freshwater sources, the Han and Nakdong rivers being the most significant, and its main lake is Lake Soyang.

Forest resources of South Korea
South Korea has a substantial forest area, representing 64.1% of its territory. Extending over 62,570 km², this forest region is a valuable source of natural resources and important habitat for local wildlife.
Worldwide, South Korea ranks 62nd for forest area.
Environmental performance and protection of South Korea’s natural resources
South Korea has an Environmental Performance Index (2024) score of 50.6 and ranks fifty-eighth (58th) on the index. It also has 5.86% of protected land and marine areas relative to its total territorial area. To learn more about the Environmental Performance Index, see the Environmental Performance Index 2024 results (Yale University).
Natural parks of South Korea: the hidden wealth of natural resources
Biodiversity: animal and plant resources of South Korea
Birds of South Korea
South Korea has great bird diversity, with a total of 420 species recorded in 2023.
However, 33 bird species are threatened in South Korea.
Among the most notable is the Oriental magpie, a common symbol of Korean identity.

Fish and amphibians of South Korea
According to 2023 data, the country recorded 21 amphibian species.
South Korea has a total of 1,107 fish species, ranking 36th in the world.
Mammals of South Korea
In 2020 a significant number of mammals were recorded, the water deer standing out among them.

Organizations that protect or study South Korea’s natural resources
- Ministry of Environment of South Korea: the national body that directs the country’s environmental and climate policy.
- Korea National Park Service (KNPS): manages and conserves national parks and their protected biodiversity.
- Korea Forest Service: administers national forests and reforestation across Korean territory.
- National Institute of Ecology (NIE): researches ecosystems and conserves species to protect Korean nature.
- Korea Environment Institute (KEI): public center researching environmental policy and national sustainable development.
- Korean Federation for Environmental Movements (KFEM): the country’s largest environmental NGO, affiliated with Friends of the Earth.
Import dependence: the defining feature of South Korea’s energy resources
The country meets almost all of its fossil fuel demand through imports. Domestic coal production fell below 1 million short tons, a low in more than four decades, against consumption of 139 million short tons in 2021 EIA, 2023.
- Net energy imports: 84.6% of total consumption in 2023 World Bank, 2023.
- Fourth-largest importer of crude oil worldwide, supplied mostly from the Middle East EIA, 2023.
- Third-largest importer of liquefied natural gas (LNG) worldwide in 2023, behind China and Japan IGU, World LNG Report 2024.
This structure exposes the South Korean economy to international prices for crude, LNG and coal. Industry offsets the lack of domestic deposits with refining, petrochemicals and export manufacturing.
Postwar reforestation: from bare hillsides to 64% forest cover
Forest cover reached 64.2% of land area in 2022 World Bank, 2022. That result comes from a replanting program launched after decades of logging.
The forests were degraded during the colonial period of 1910-1945 and the Korean War of 1950-1953. In 1961, unstocked forest land accounted for 41% of the total FAO, 1997.
- Between 1961 and 1995, 3.97 million hectares were replanted with 10,864 million seedlings FAO, 1997.
- Growing stock rose from 63.9 million m³ in 1960 to 309 million m³ in 1995 FAO, 1997.
- Wooded area grew from 4 to 6.3 million hectares over that period FAO, 1997.
Fisheries and aquaculture: 3.6 million tonnes from a sea turned into a resource
Total fisheries and aquaculture production came to 3.60 million tonnes in 2022 World Bank, 2022. Farmed output now exceeds wild capture.
- Marine and inland capture: 1.29 million tonnes in 2022 World Bank, 2022.
- Aquaculture: around 2.31 million tonnes in 2022, most of the total World Bank, 2022.
The sea supplies protein, coastal employment and raw material for processing seaweed and marine products.
Environmental performance: 58th on Yale’s Environmental Performance Index
South Korea scored 50.6 points and ranked 58th of 180 countries on the 2024 Environmental Performance Index (EPI) Yale EPI, 2024.
- Air pollution: 36th, with 87.3 points Yale EPI, 2024.
- Water resources: 16th, with 84.3 points Yale EPI, 2024.
- Biodiversity and habitat: 139th, with 32.8 points Yale EPI, 2024.
The index combines strengths in water and air management with weaknesses in habitat conservation and threatened species.
Frequently asked questions
How much energy does South Korea import?
It imported 84.6% of its energy in 2023 World Bank, 2023. It is the fourth-largest importer of crude worldwide EIA, 2023 and the third-largest of LNG IGU, 2024.
What share of South Korean territory is forest?
64.2% of land area was forested in 2022 World Bank, 2022, after 3.97 million hectares were replanted between 1961 and 1995 FAO, 1997.
How much fish does South Korea produce?
Total fisheries and aquaculture production was 3.60 million tonnes in 2022, with 1.29 million from capture World Bank, 2022.
Leave a Reply