

The fundamental difference between renewable and non-renewable resources is their replacement timescale: renewable resources regenerate naturally within human timeframes (from instantaneous solar irradiance to decades for mature forests), whereas non-renewable resources require millions of years of geological heat and pressure to accumulate, meaning their planetary stock is finite. In 2024, clean energy sources generated a historic 40.9% of global electricity, while fossil fuels still supplied 59.1%. How do their lifespans, depletion dynamics, and environmental impacts compare?
In environmental science and energy economics, no distinction carries greater practical consequence than the dividing line between renewable and non-renewable resources. The choice of which resources civilization relies upon determines whether economic prosperity can continue indefinitely or whether it faces an inevitable physical wall of depletion, rising extraction costs, and ecological degradation.
Table de contenidos
For more than two centuries, the industrial era was powered almost entirely by extracting concentrated geological stocks of coal, crude oil, natural gas, and mined metals. Today, driven by technological breakthroughs, plummeting costs for solar and wind equipment, and the urgent imperative to halt climate change, the global energy system is undergoing its fastest structural transformation in history. Understanding how renewable and non-renewable resources operate—and the exact timescales required for their replenishment—is essential for evaluating the ongoing energy transition.
What Are Renewable Resources?
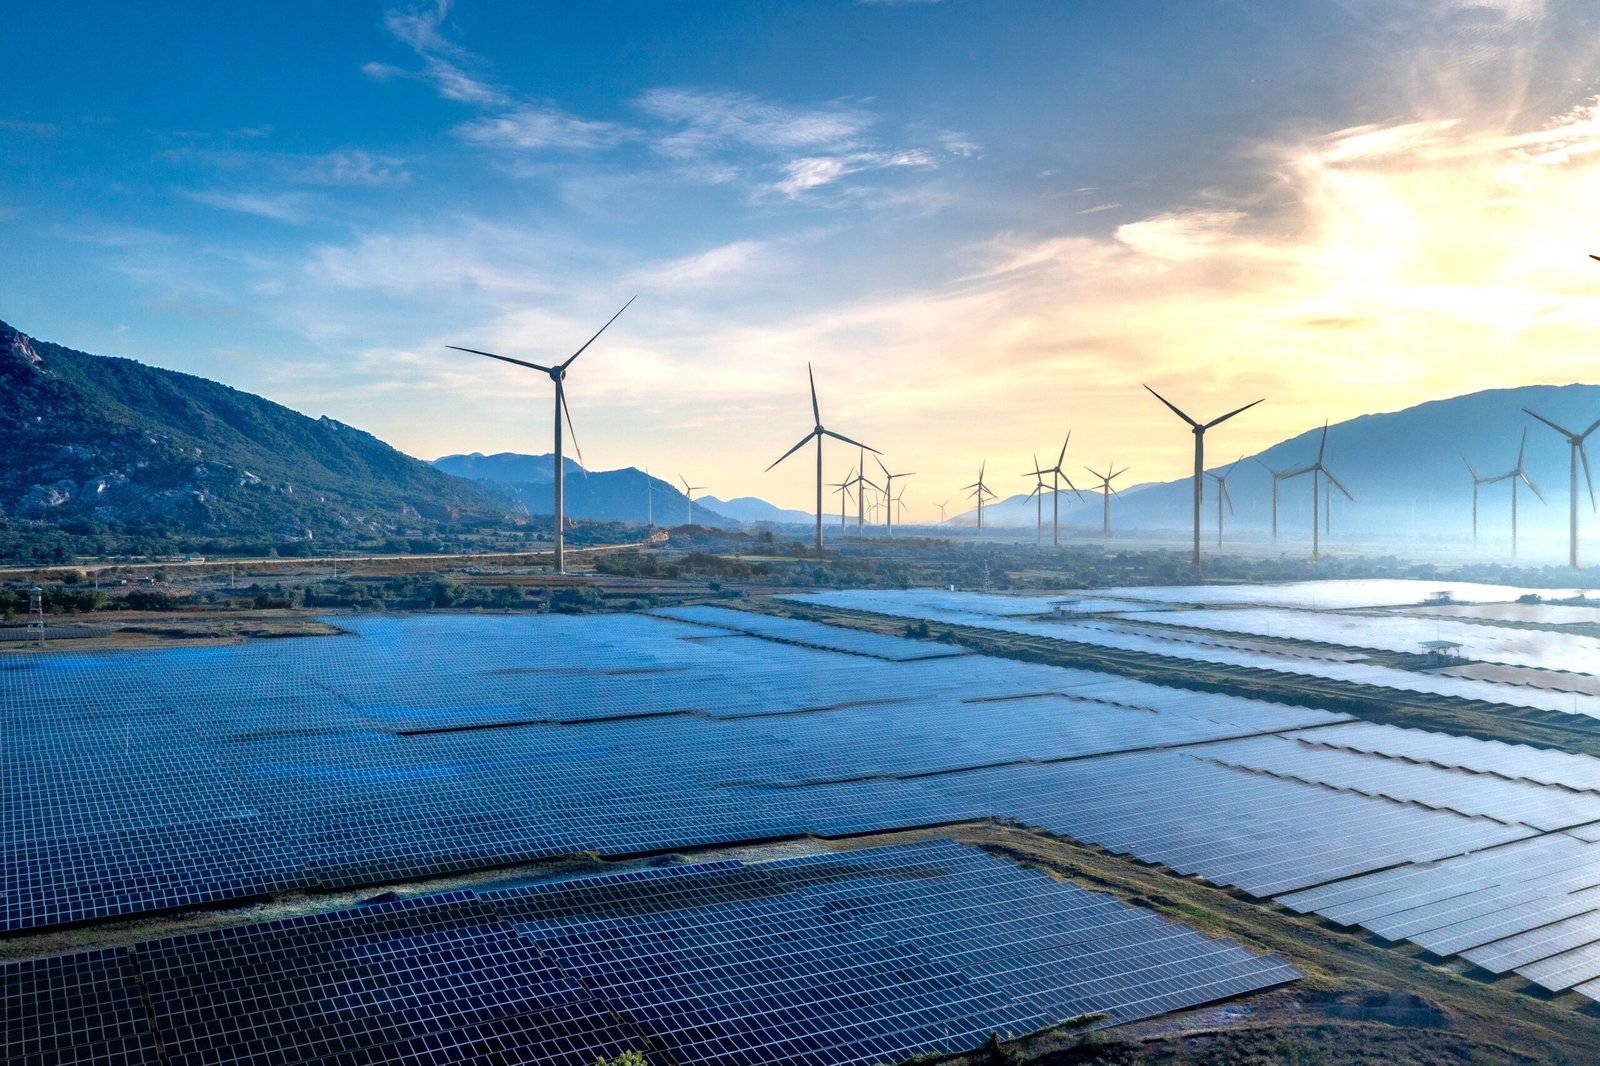
As explored in detail in our dedicated guide to renewable natural resources, these are assets that regenerate through ongoing biological reproduction or active biogeochemical cycles at a rate equal to or faster than the rate at which humans consume them. They fall into two primary types:
- Continuous (Inexhaustible) Flows: Physical energy streams that remain active regardless of the volume harnessed by humanity. Solar radiation, planetary wind patterns, gravitational ocean tides, and deep geothermal heat continue to flow indefinitely.
- Replenishable Biological and Hydrological Stocks: Living ecosystems (commercial timber, marine fisheries, agricultural crops) and hydrological runoff (river flows, seasonal lake recharge). These resources are renewable only if harvested below their maximum sustainable yield; over-harvesting can exhaust the breeding stock or degrade the underlying ecological habitat.
What Are Non-Renewable Resources?
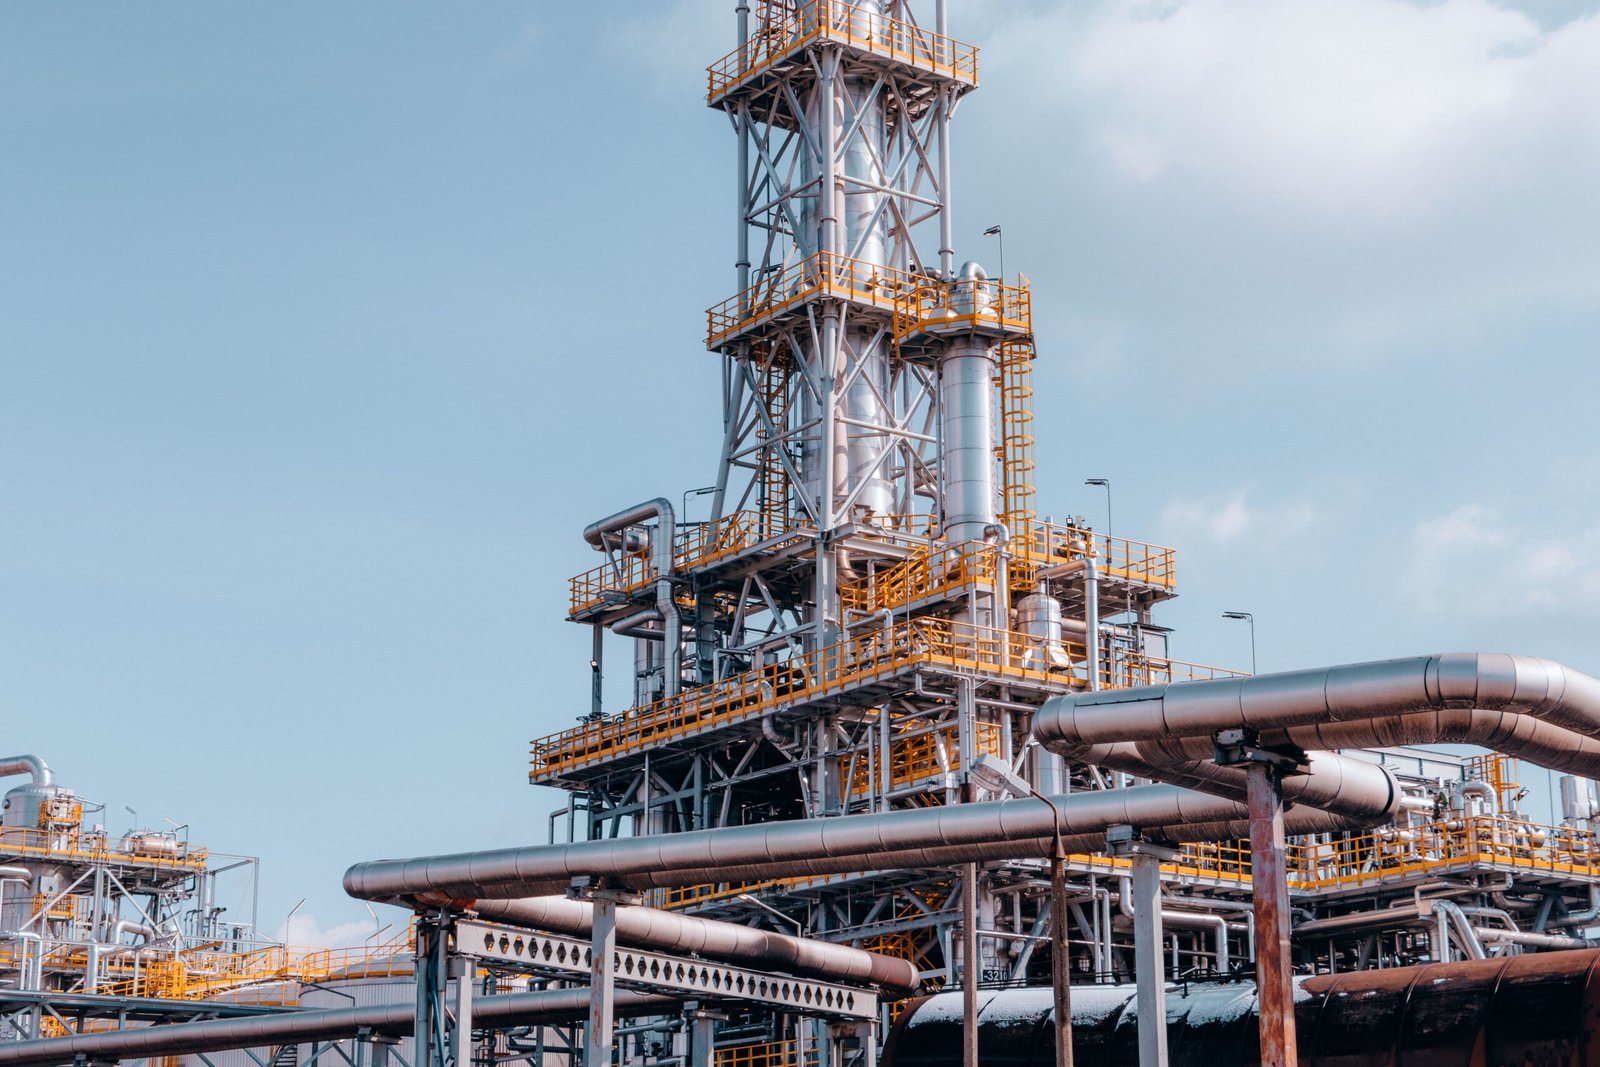
As detailed in our analysis of non-renewable natural resources, these are finite geological assets that exist in fixed quantities within the Earth’s crust. They formed under extraordinary temperatures, pressures, and chemical conditions over millions of years of Earth history. Once extracted and consumed, they cannot be replenished on any timescale relevant to human society.
- Fossil Hydrocarbons: Coal formed from ancient Carboniferous swamp vegetation buried 300 to 350 million years ago; crude oil and natural gas formed from microscopic marine plankton deposited in oxygen-depleted ocean basins 66 to 250 million years ago. When burned, their chemical energy is released, and their carbon is converted into atmospheric greenhouse gases.
- Metallic and Industrial Minerals: Concentrations of iron ore, copper, bauxite, lithium, cobalt, and rare earth elements generated by ancient magmatic intrusions, hydrothermal vents, or sedimentary weathering over tens of millions of years. While metals are not chemically destroyed during use, mining extracts the highest-grade deposits first, leaving lower-grade ores that require escalating energy and water to process.
Key Differences: Comprehensive Comparison Table and Replacement Timescales
The table below summarizes the crucial structural distinctions between renewable and non-renewable resources, highlighting the vast disparity in their natural replacement timescales:
| Comparison Dimension | Renewable Resources | Non-Renewable Resources | Key Nuance / Transition Implication |
|---|---|---|---|
| Natural Replacement Timescale | Instantaneous to decades • Solar / Wind: 0 seconds (continuous) • Agricultural crops: 3–12 months • Fast-growing timber: 15–30 years • Surface river runoff: Days to weeks | Millions of years • Crude oil / Gas: 50–200 million years • Thermal / Coking coal: 300+ million years • Primary metallic veins: 10–500 million years | Humanity currently consumes roughly 100 million barrels of crude oil every single day—an amount nature required several hundred thousand years to synthesize. |
| Physical Availability & Stock | Theoretically infinite or cyclically restored; constrained primarily by capture technology and surface area. | Strictly finite in total planetary mass; subjected to diminishing returns and falling ore grades over time. | Non-renewables face depletion of high-quality “easy” reserves, requiring deeper drilling, open-pit expansion, and higher capital intensity. |
| Operational Carbon Footprint | Zero or near-zero direct greenhouse gas emissions during power generation. | Very high; the burning of coal, oil, and gas accounts for over 75% of global anthropogenic CO₂ emissions. | Renewable technologies do require mineral inputs during manufacturing (steel, glass, polysilicon), but their lifecycle emissions are 90–95% lower than fossil plants. |
| Geopolitical Distribution | Widely dispersed across all geographies; every country receives solar irradiance and wind flows. | Highly concentrated in specific geological sedimentary basins and cratonic shields. | Fossil concentration has historically caused geopolitical friction and vulnerability to embargoes; renewables allow localized distributed generation. |
| Economic Cost Trends | Deflationary technology curve; levelized cost of energy (LCOE) for solar fell ~85% and wind ~60% between 2010 and 2024. | Volatile commodity curve; governed by international cartel pricing, exploration risk, and geopolitical instability. | Once built, renewable generators require zero fuel expenditure, eliminating exposure to volatile global commodity markets. |
| Global Power Share (2024) | 40.9% of global electricity generation (clean power including hydro, nuclear, solar, and wind). | 59.1% of global electricity generation (coal: 35.4%, gas: 22.5%, oil: ~1.2%). | According to Ember’s Global Electricity Review, 2024 marked the first year clean sources produced more than 40% of the world’s electricity. |
Global Realities in Figures: The 2024–2026 Energy Matrix
Tracking the competition between renewable and non-renewable energy reveals a decisive tipping point in the global power sector:
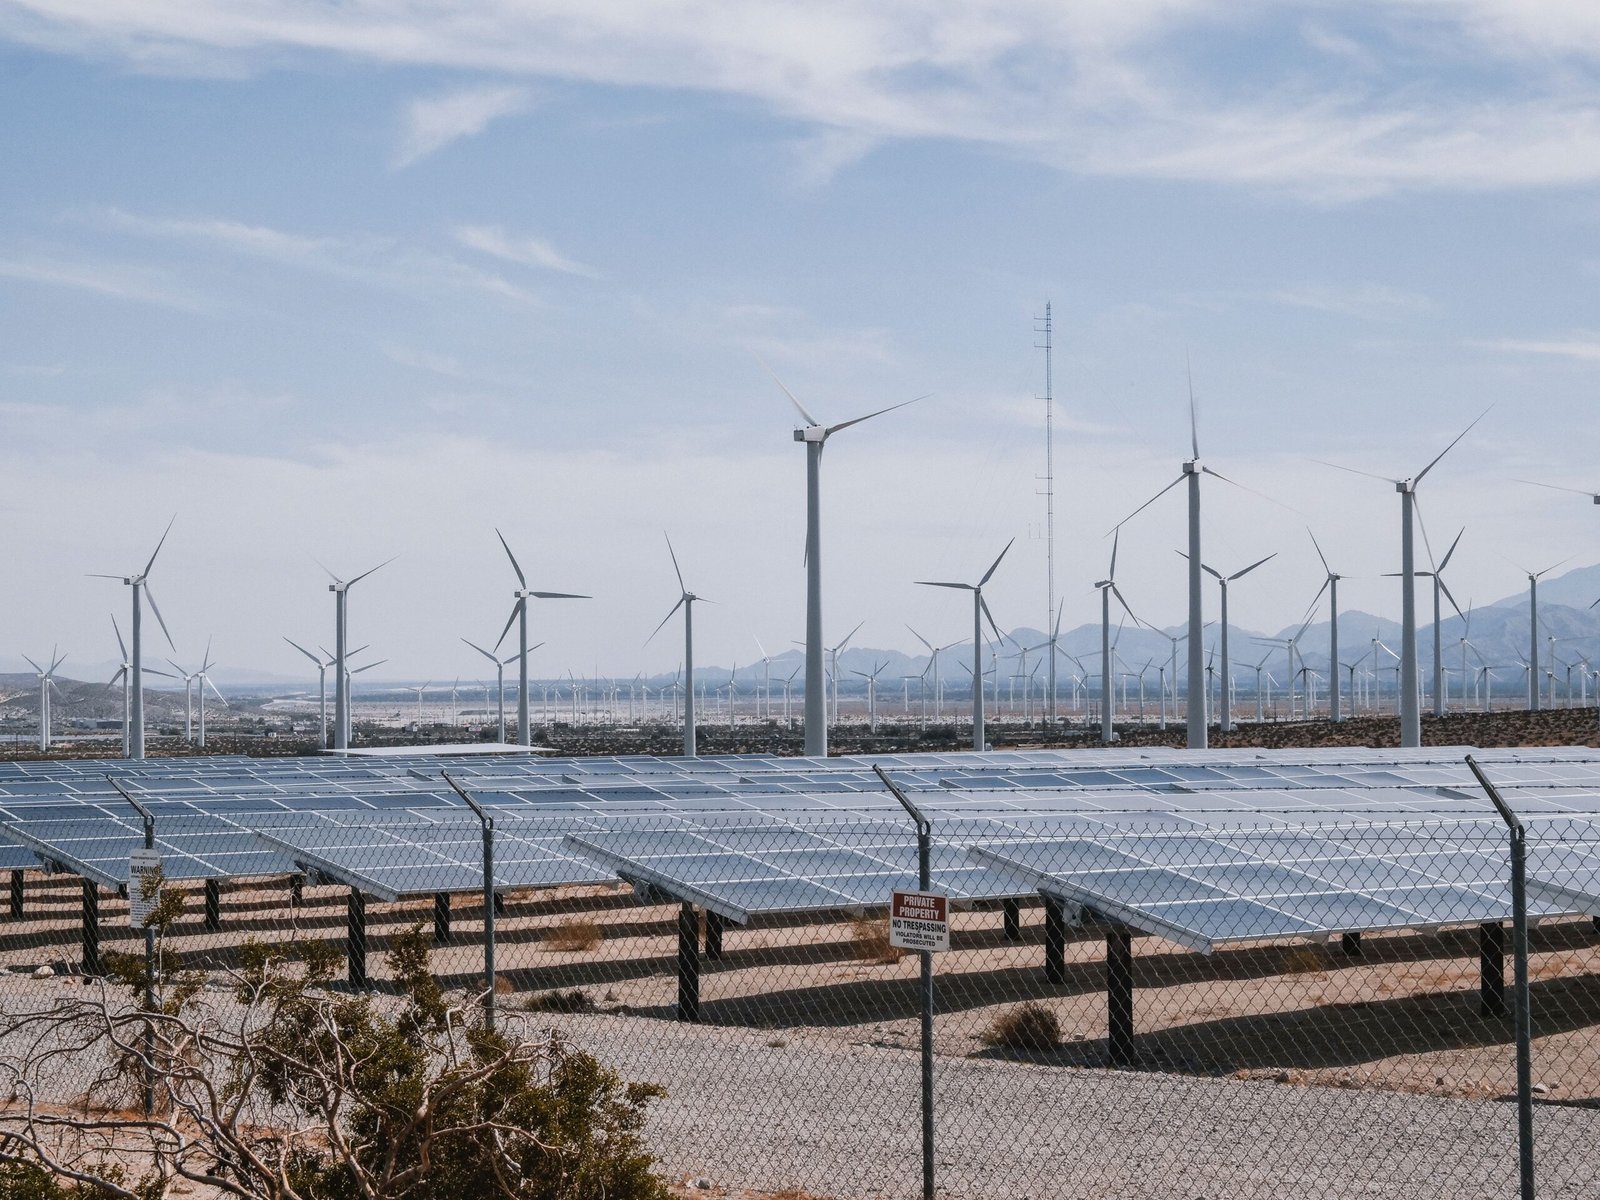
- Record Additions of Clean Capacity: According to the International Energy Agency (IEA), global renewable capacity grew by over 510 gigawatts (GW) in 2023 and approached 600 GW in 2024. Solar photovoltaics accounted for three-quarters of all new generation capacity installed worldwide.
- The Inflexion Point in Power Generation: Data from the energy think tank Ember confirms that clean electricity generation reached 40.9% globally in 2024, led by hydroelectricity (14.2%), nuclear power (9.1%), wind (7.8%), and solar (5.5%). Fossil fuels fell below 60% for the first time in modern industrial history.
- The Mineral Reality of the Transition: While renewable energy requires no ongoing fossil fuels to burn, constructing wind turbines, solar panels, and battery storage requires significantly more minerals per megawatt than fossil fuel generators. An offshore wind plant requires nine times more mineral resources than a comparable gas-fired plant, underscoring that the renewable energy transition depends on sustainable mineral supply chains.
Leading Countries: How Geography Dictates Resource Strategy
Different nations showcase how diverse natural endowments shape energy strategies:
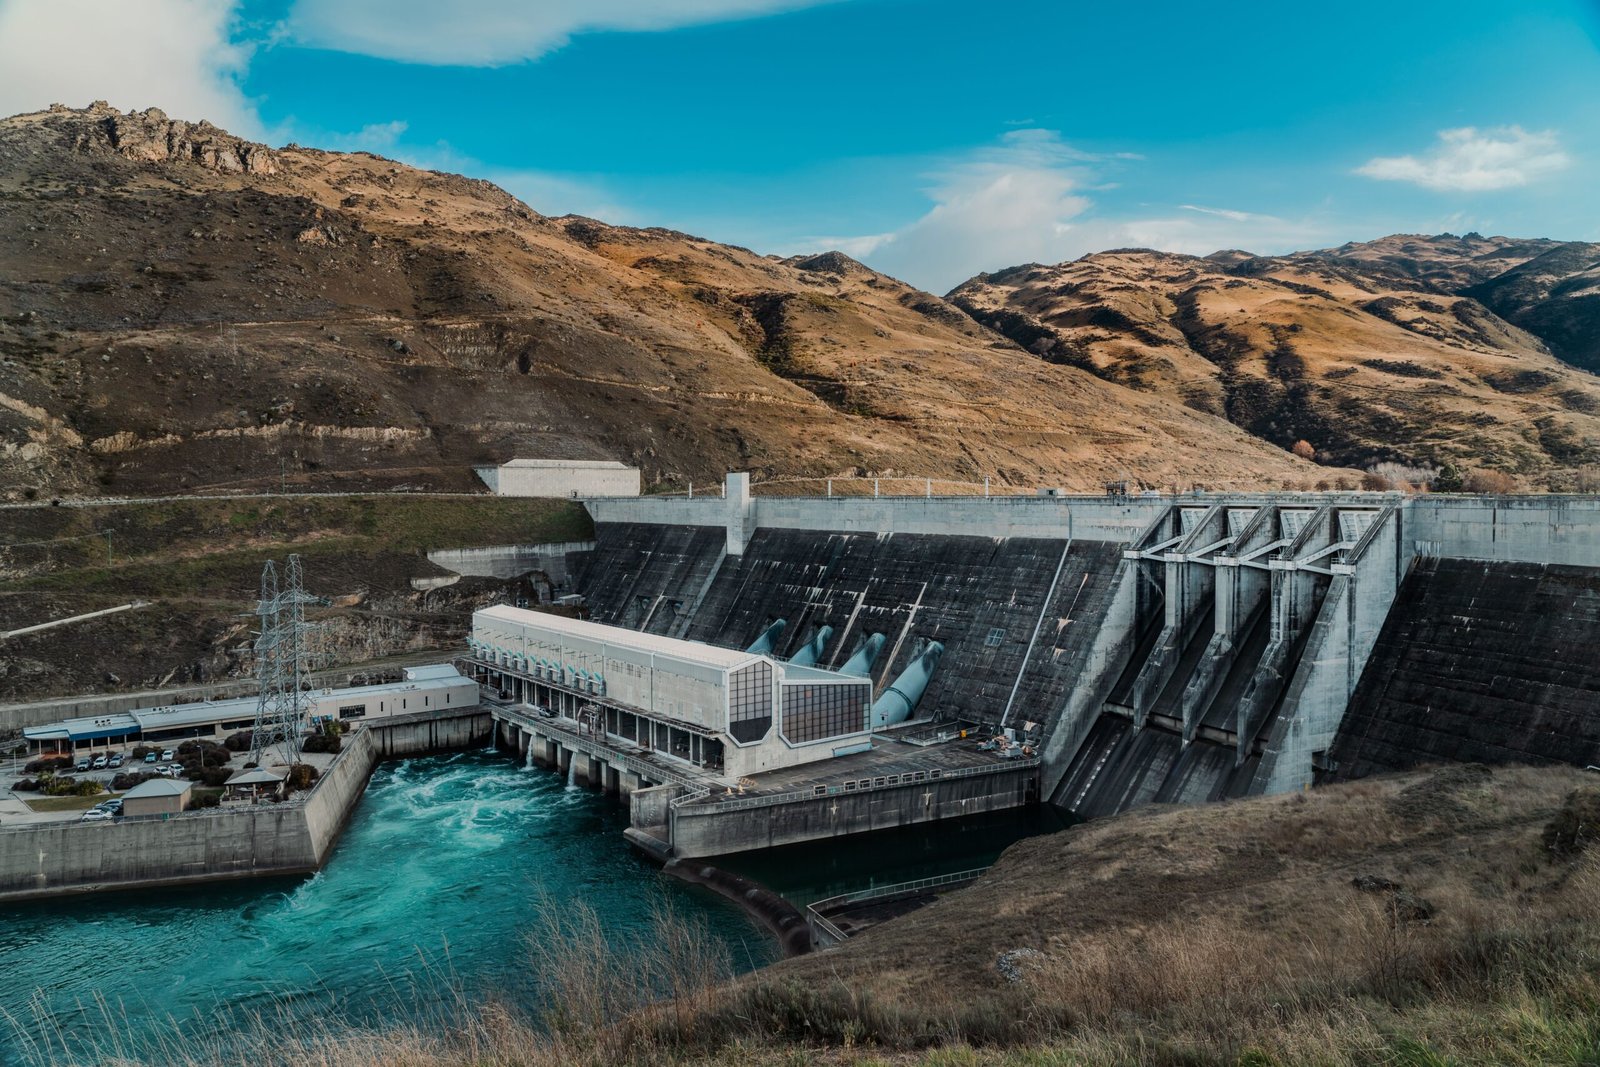
- Clean Energy Leaders: Countries like Costa Rica generate more than 98% of their electricity from renewable sources (hydro, geothermal, and wind). In South America, Brazil generates over 85% of its electricity from clean sources thanks to vast river basins and thriving wind corridors. In Europe, nations like Spain and Germany regularly achieve days where solar and wind cover over 60% of national power demand.
- Major Fossil Fuel Producers: In contrast, economies like the United States, Russia, Saudi Arabia, and Nigeria possess enormous fossil hydrocarbon reserves, which generate significant export revenues but create substantial domestic transition challenges.
To examine verified data on renewable capacity and fossil reserves for over 160 countries, consult our detailed Natural Resources by Country directory.
Authoritative Data Sources Used
All data and comparative metrics presented in this analysis are sourced from primary official reports:
- Ember Energy: Global Electricity Review.
- International Energy Agency (IEA): Renewables Market Report and The Role of Critical Minerals in Clean Energy Transitions.
- International Renewable Energy Agency (IRENA): Renewable Power Generation Costs.
- United States Geological Survey (USGS): National Minerals Information Center.
- Learn about our strict factual verification process in our Research Methodology and Official Sources.

Leave a Reply