

Mineral resources are naturally occurring inorganic substances in the Earth’s crust with definite chemical compositions and physical properties, categorized into metallic minerals (iron, copper, lithium), industrial minerals (phosphates, gypsum), and energy minerals (uranium, coal). In resource economics, a critical distinction separates occurrences (geological presence), reserves (economically extractable deposits), extraction (raw ore mined), and production (refined usable commodity). Chile holds roughly 20% of global copper reserves, while Australia leads global lithium extraction. What are the major mineral types, and how does the mining supply chain operate?
From the reinforced steel rebars inside skyscrapers to the microscopic copper circuitry and lithium-ion batteries powering electric vehicles, modern civilization is built upon mineral resources. Unlike biological resources such as forests and fisheries that can regenerate within human generations, minerals are non-renewable assets created through tectonic, magmatic, and hydrothermal processes operating over millions of years.
Table de contenidos
According to the United States Geological Survey (USGS), the average modern citizen utilizes dozens of distinct mineral commodities daily, directly or indirectly. As the global economy accelerates its transition toward renewable energy, electric mobility, and digital automation, demand for critical transition minerals—such as copper, lithium, nickel, cobalt, and rare earth elements—is projected by the International Energy Agency (IEA) to increase up to fourfold by 2040. Understanding the classification of minerals and the precise technical distinctions between geological discoveries and commercial production is vital for analyzing supply security and environmental sustainability.
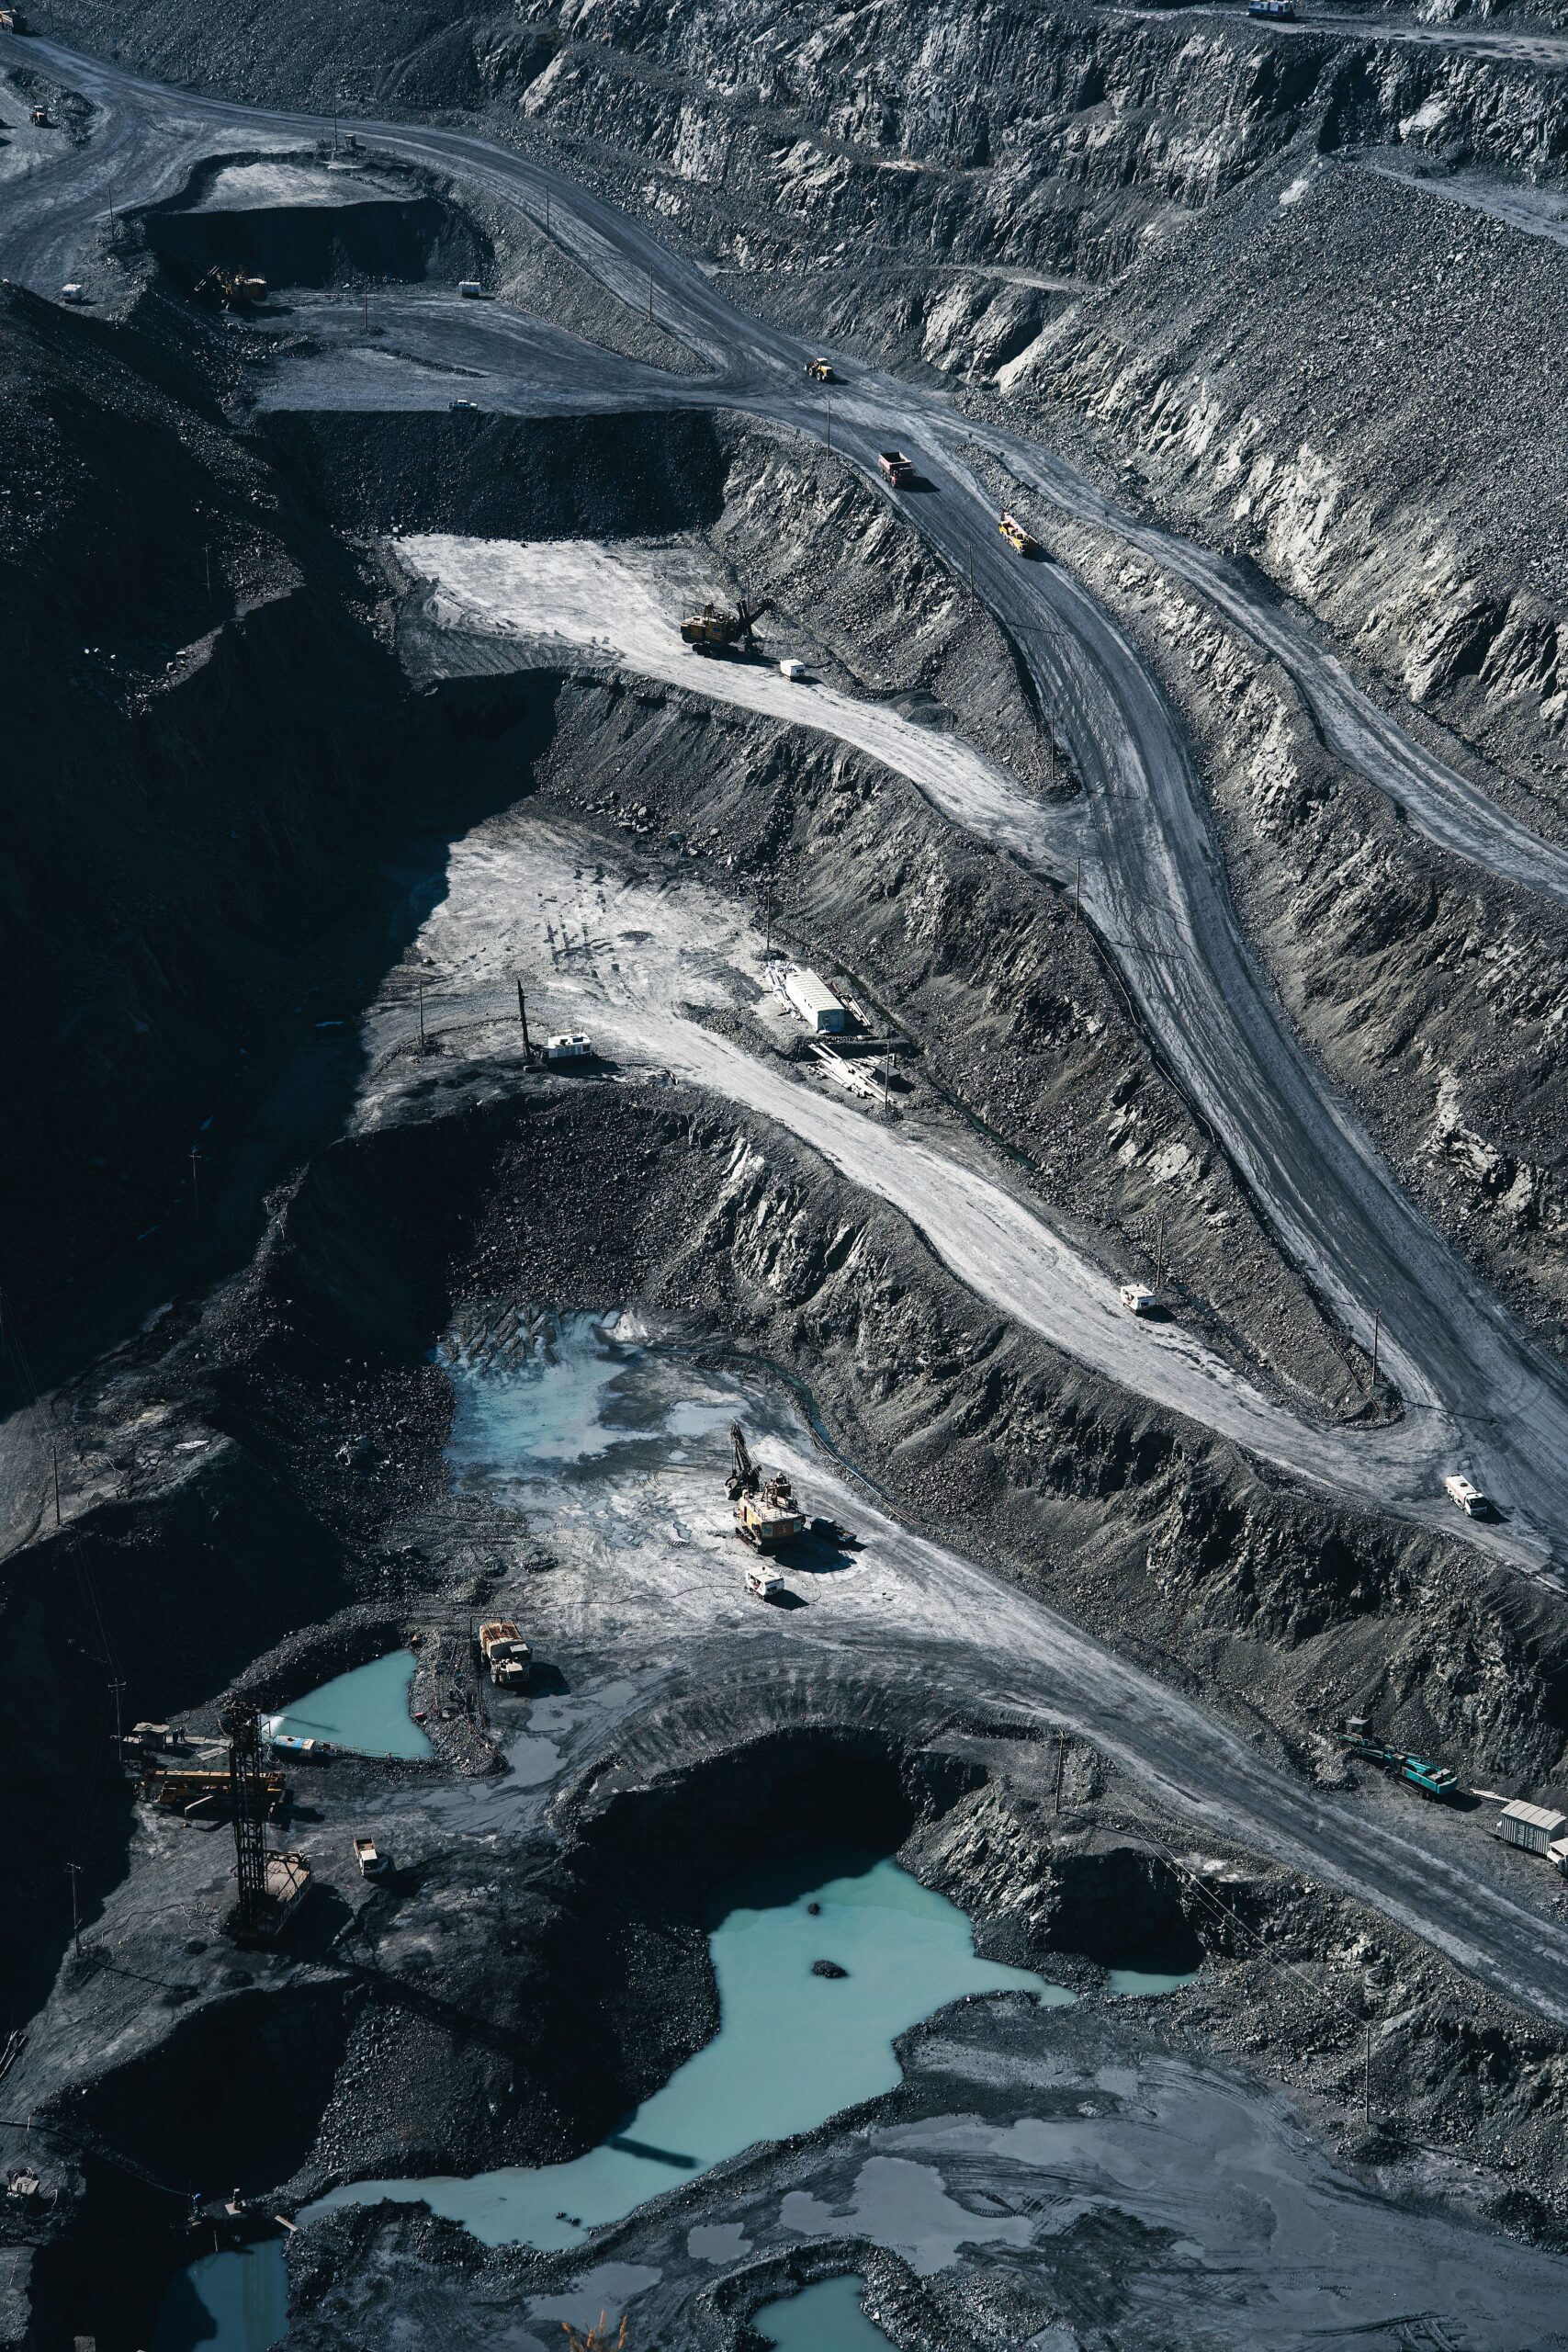
Classification of Mineral Resources: Three Primary Categories
Geologists and mineral economists group minerals into three primary commercial classes based on their chemical composition and industrial applications:
1. Metallic Minerals
Metallic minerals contain one or more metallic elements and typically exhibit luster, electrical conductivity, malleability, and high tensile strength. They are subdivided into:
- Ferrous Metals: Dominated by iron ore, manganese, chromium, and nickel. Iron ore is the primary ingredient of steel, which represents over 90% of all metal consumed by human society annually.
- Base and Non-Ferrous Metals: Copper, aluminum (derived from bauxite ore), zinc, and lead. Copper is essential for electrical power transmission and motors, while aluminum provides lightweight strength for transport and aerospace.
- Precious Metals: Gold, silver, and platinum-group metals (PGMs). Valued for jewelry and investment bullion, they also serve indispensable technological functions as corrosion-resistant electronic contacts and automotive catalytic converters.
- Critical and Technology Minerals: Lithium, cobalt, graphite, and rare earth elements (such as neodymium and dysprosium). These elements are indispensable for lithium-ion battery cathodes, permanent magnets in wind turbines, and advanced defense microchips.
2. Industrial and Non-Metallic Minerals
Non-metallic minerals are prized for their specific physical or chemical properties rather than metallic content. They represent enormous physical volumes in modern industry:
- Construction Aggregates: Sand, gravel, crushed stone, limestone, and gypsum. Sand and gravel are the most extracted solid materials on Earth (exceeding 50 billion tonnes annually), serving as the primary components of concrete and asphalt.
- Agricultural Fertilizer Minerals: Phosphate rock, potash (potassium chloride), and sulfur. These minerals provide the essential macro-nutrients required to maintain global crop yields and prevent widespread food deficits.
- Chemical and Manufacturing Minerals: Quartz (silica sand for glass and solar silicon wafers), kaolin, talc, fluorite, and industrial diamonds used in precision cutting and abrasive tools.
3. Energy Minerals
Energy minerals are mineral substances utilized as fuel to generate heat and electricity. While fossil hydrocarbons (coal, oil, gas) are often categorized under broad energy resources, solid mineral fuels such as thermal coal, lignite, and uranium ore (the primary fuel for commercial nuclear reactors) are mined directly from geological rock strata.
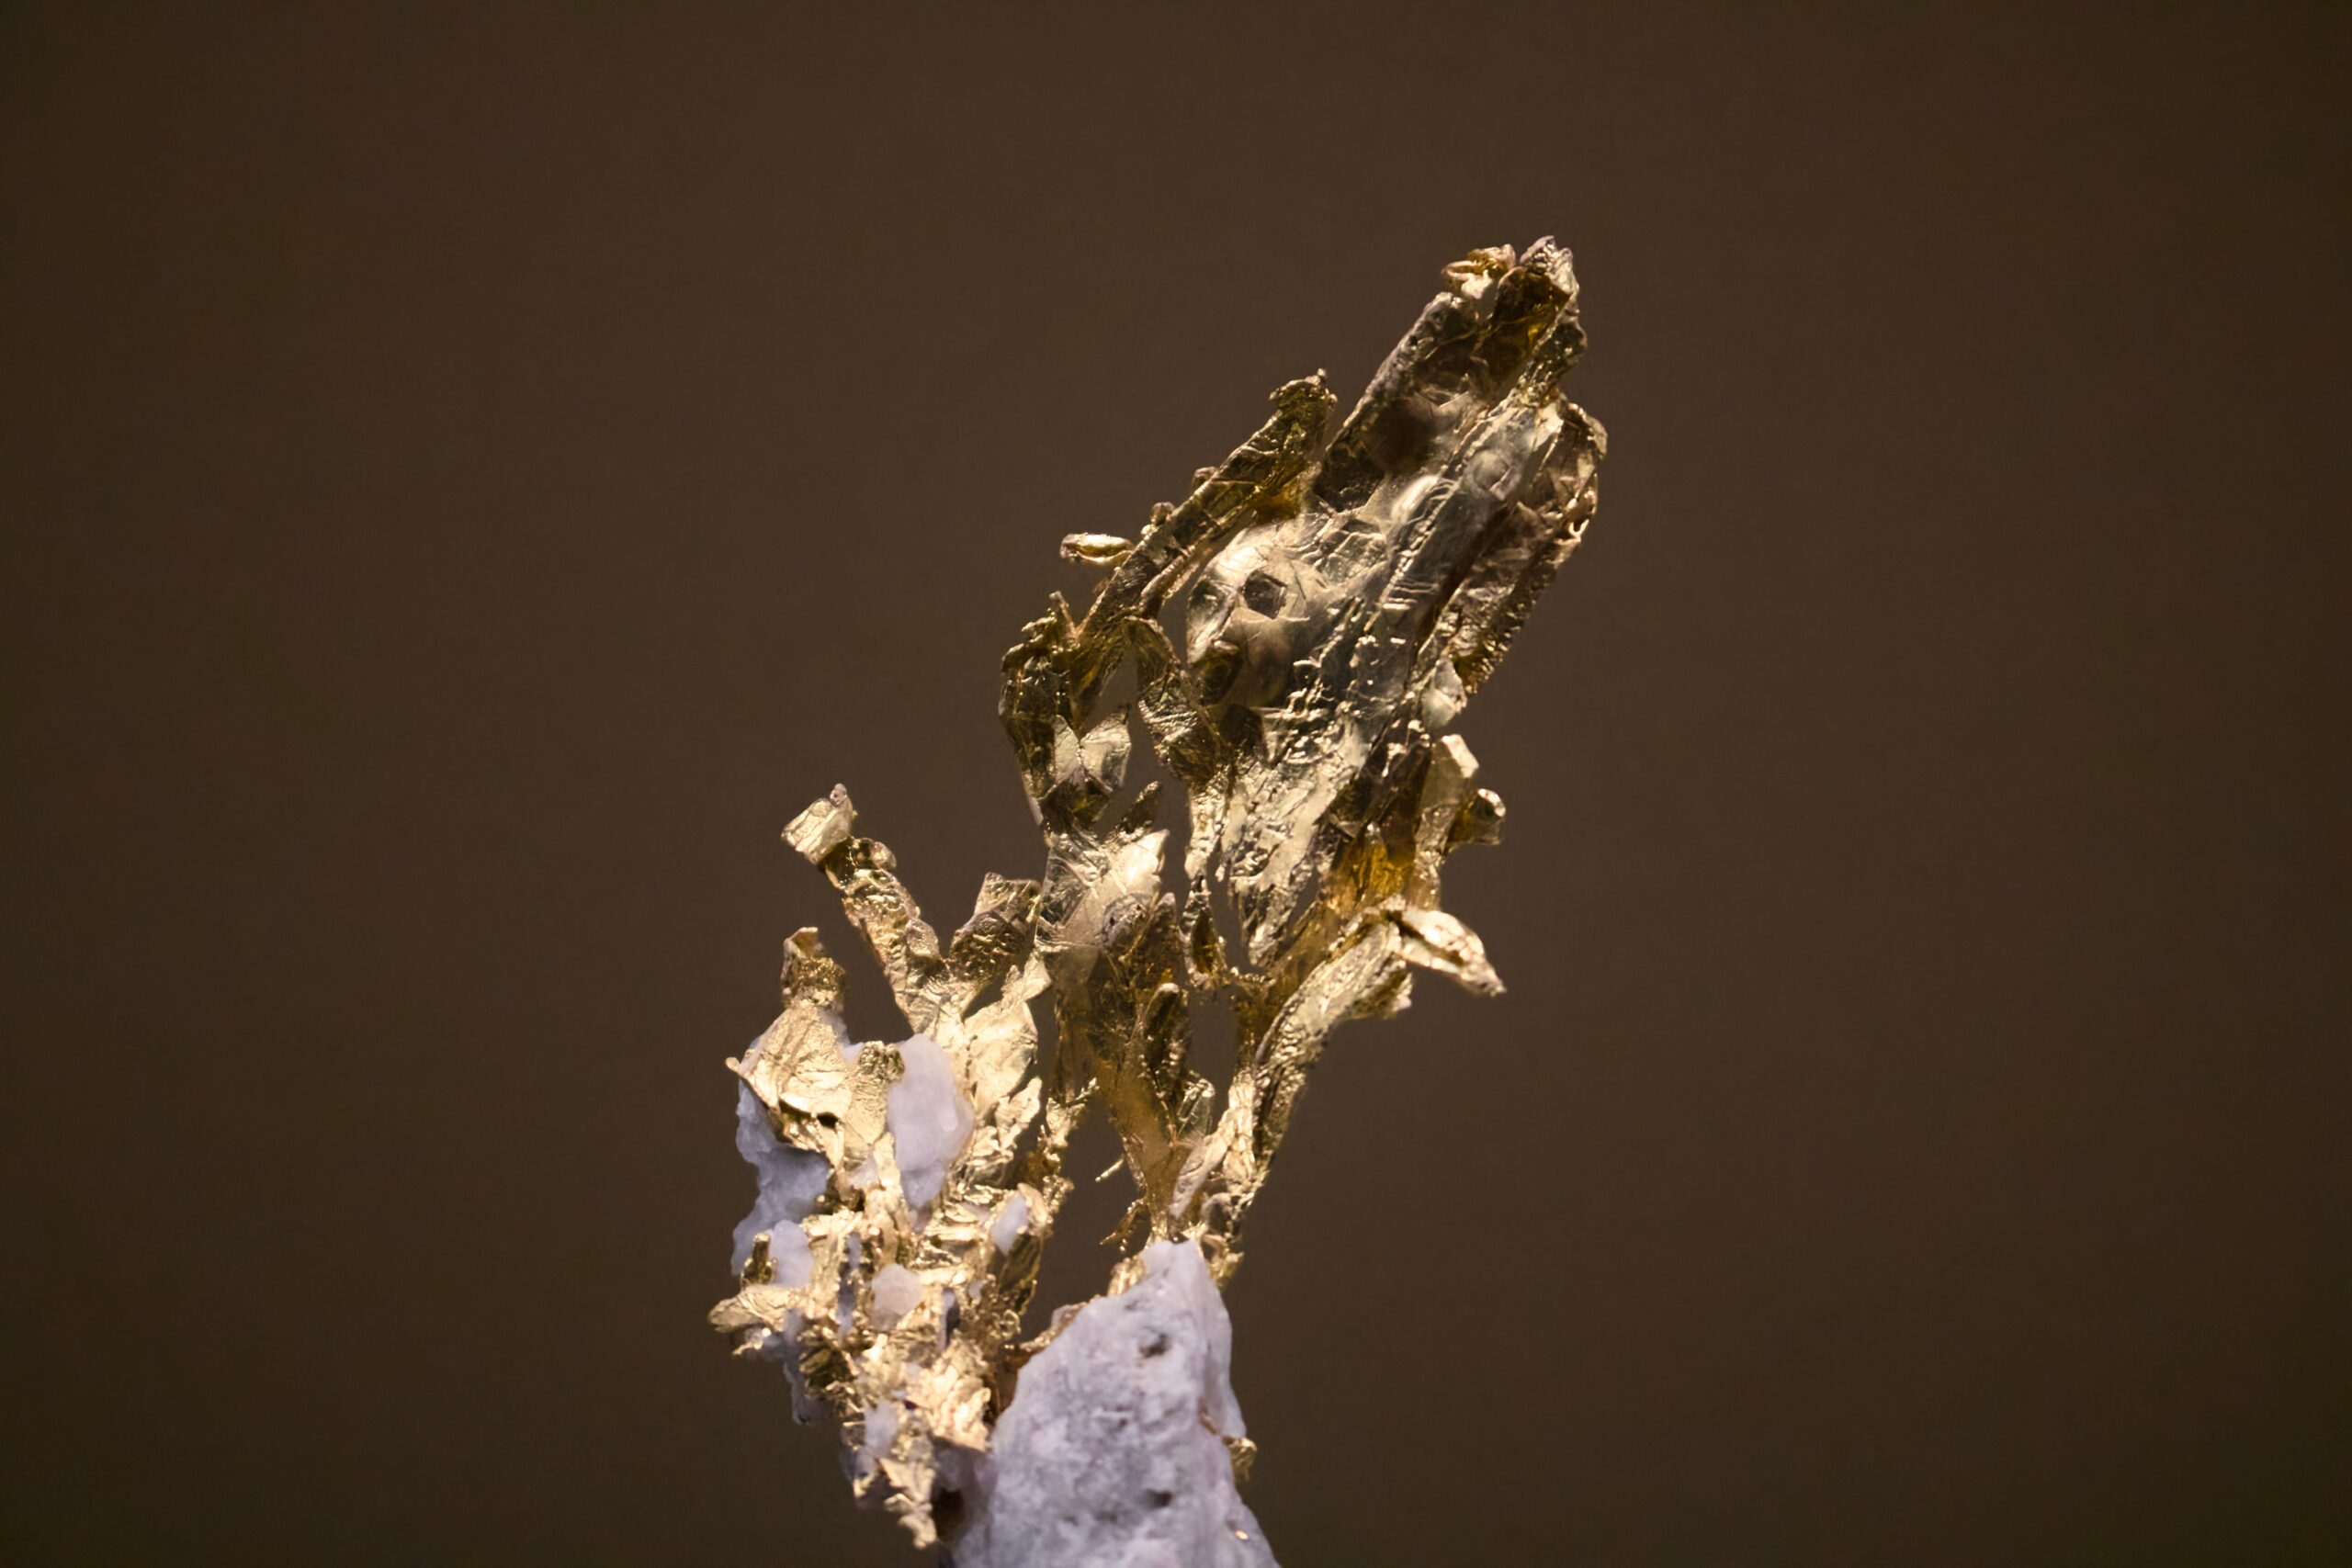
The Crucial Distinction: Occurrence vs. Reserves vs. Extraction vs. Production
A frequent error in public debates and economic reporting is conflating the total physical presence of a mineral with the amount that can actually be mined and sold. In professional mineral economics and standard reporting codes (such as CRIRSCO, JORC, and NI 43-101), four distinct phases are strictly separated:
| Stage | Technical Definition | Key Criteria & Limiting Factors | Concrete Real-World Example |
|---|---|---|---|
| 1. Mineral Occurrence (Resource) | The geological presence of a mineral concentration in the crust, confirmed by exploration drilling or sampling. | Geological evidence only. No requirement for profitability, legal permits, or available processing infrastructure. | Seawater contains an estimated 4 billion tonnes of dissolved uranium, and deep ocean floor plains hold trillions of dollars in polymetallic nodules. They are vast occurrences, but not reserves today. |
| 2. Mineral Reserves | The economically and legally mineable portion of a measured or indicated mineral resource under current market conditions. | Must possess proven metallurgical feasibility, economic profitability at prevailing commodity prices, environmental permits, and legal tenure. | Chile holds roughly 190 million tonnes of identified copper reserves that can be mined profitably with existing solvent-extraction and flotation technologies. |
| 3. Mineral Extraction (Mining) | The physical removal of raw mineralized rock (ore) from the Earth’s crust via surface open-pit or underground methods. | Measured in gross tonnage of run-of-mine ore and waste rock (overburden). Ore typically contains only 0.5% to 2% target metal. | To obtain 1 tonne of copper, a mining company often extracts 150 to 200 tonnes of raw copper porphyry ore, plus several hundred tonnes of surrounding waste rock. |
| 4. Mineral Production (Refining) | The processing, smelting, refining, or concentration of extracted ore into standardized, high-purity commercial commodities. | Measured in pure metal content (e.g., London Metal Exchange Grade A cathode, 99.99% pure copper). | Chile mines raw ore that yields ~5.3 million tonnes of copper metal annually. Some is refined locally, while large volumes of concentrate are exported to China for final smelting. |
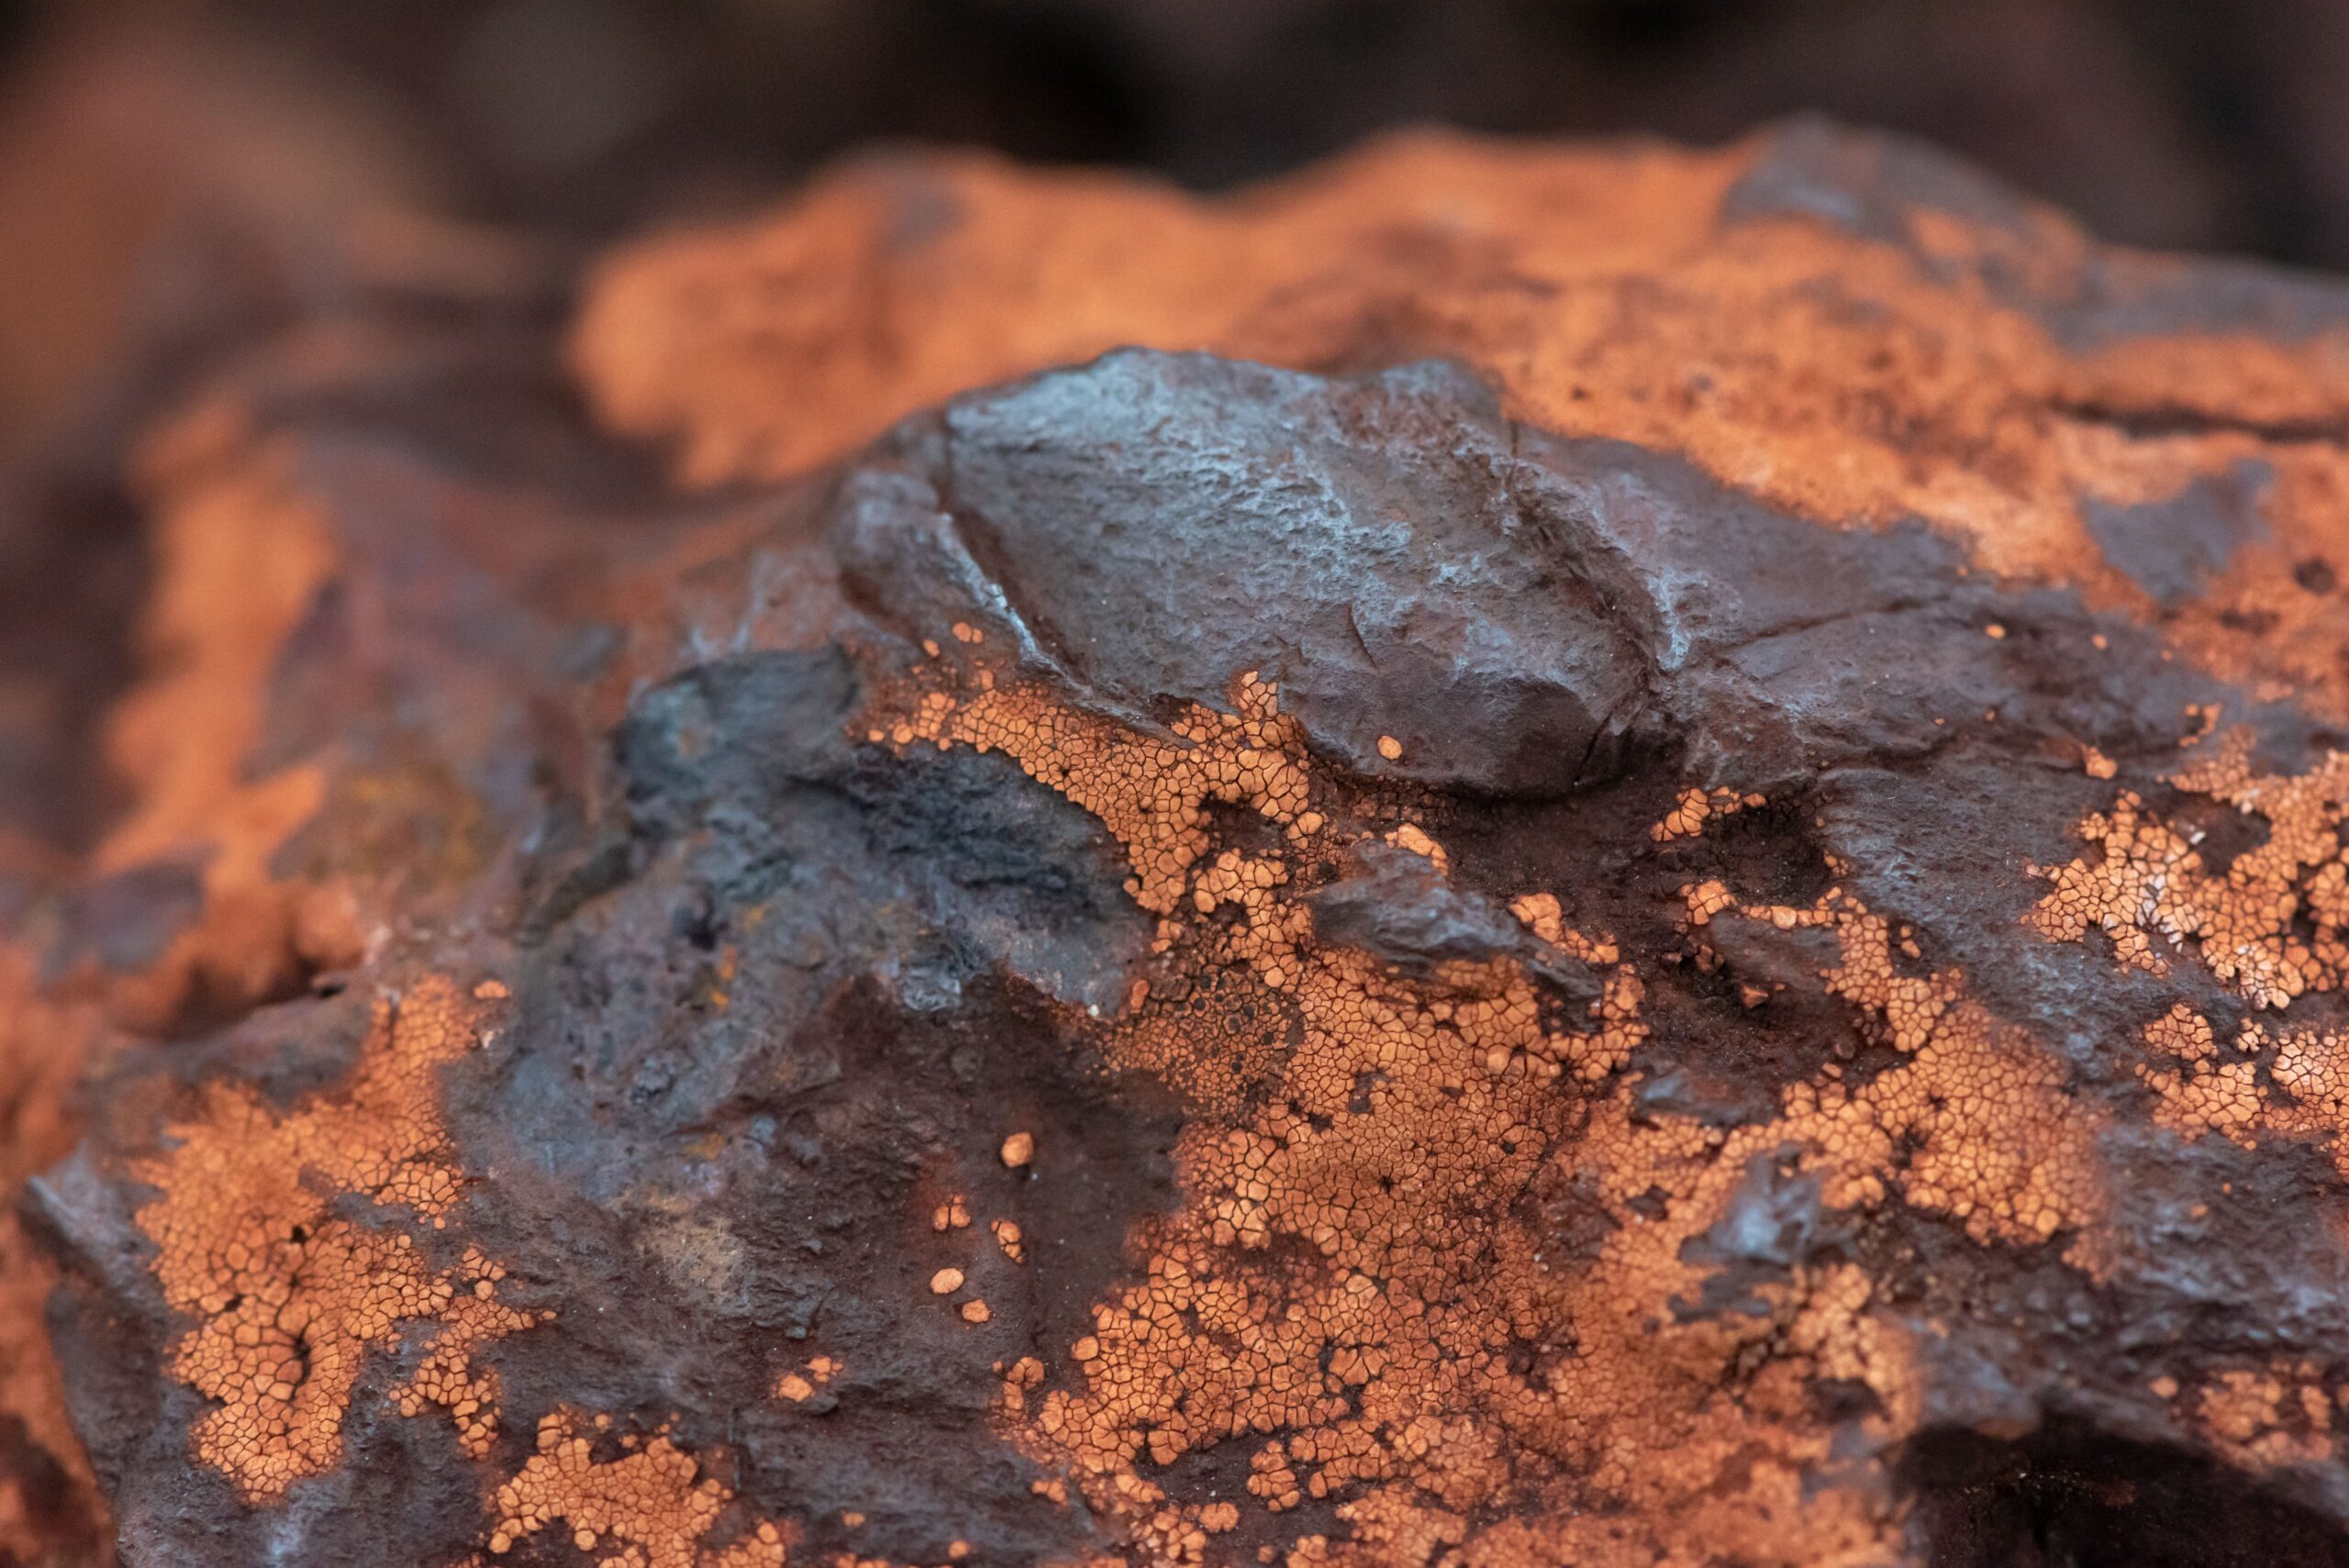
Leading Mineral-Producing Countries: Global Concentration
Unlike agricultural land, mineral wealth is distributed with extreme geological concentration dictated by ancient plate tectonics and cratonic shields:
- Copper: Chile is the world’s unquestioned copper leader, producing roughly 24% of global mine output, followed by Peru, the Democratic Republic of the Congo, and China.
- Iron Ore: Australia and Brazil jointly account for more than 50% of world iron ore production, with Australia’s Pilbara region and Brazil’s Carajás complex operating as the world’s most productive mining hubs.
- Lithium and Battery Metals: Australia leads global hard-rock (spodumene) lithium extraction, while the “Lithium Triangle” of Chile, Argentina, and Bolivia contains over half of the world’s lithium brine resources. The Democratic Republic of the Congo produces more than 70% of the world’s cobalt, while Indonesia commands over 50% of global nickel production.
- Silver and Gold: Mexico remains the world’s number one silver producer, followed by China and Peru. Gold production is diversified across China, Australia, Russia, Canada, and the United States.
- Niobium: Brazil holds a virtual global monopoly, supplying over 90% of global niobium production, an essential micro-alloying element that increases steel strength for gas pipelines and aerospace components.
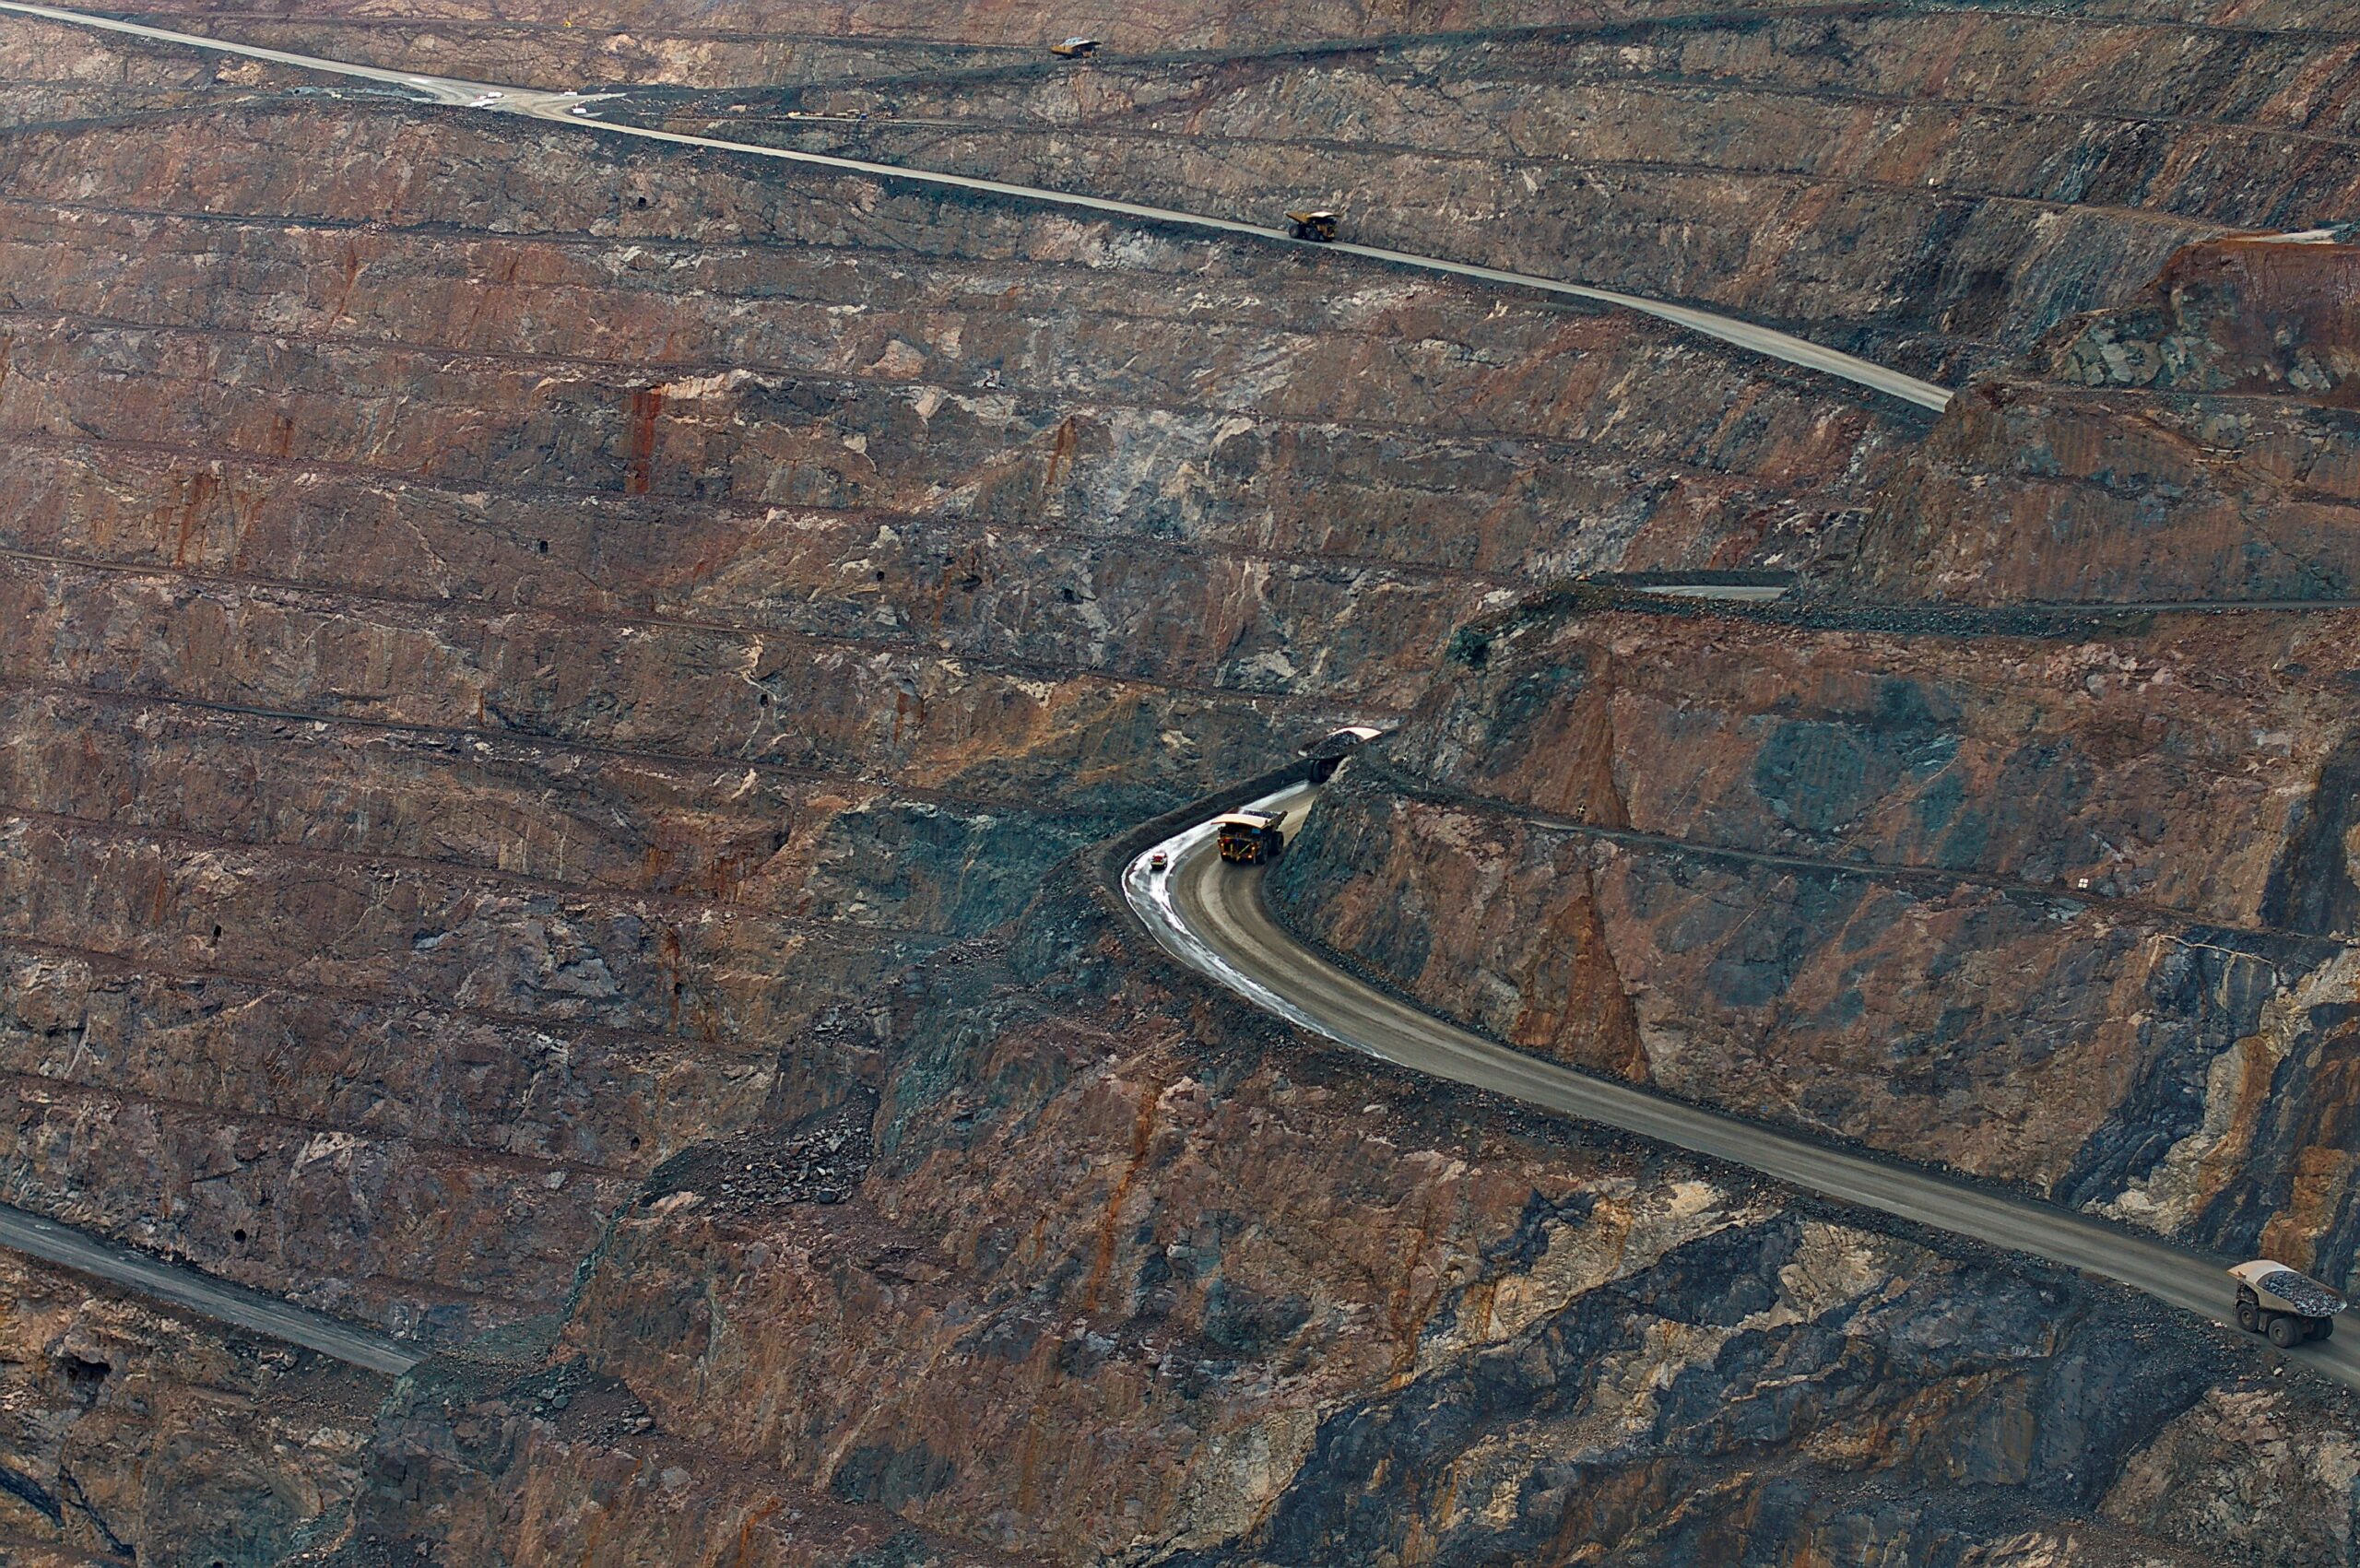
Environmental Impacts and the Imperative of Circular Metallurgy
While minerals are indispensable for human infrastructure and clean technologies, extraction carries significant ecological costs. Mining generates billions of tonnes of mine tailings, consumes substantial volumes of water in arid mountain basins (such as the Atacama Desert in Chile), and accounts for roughly 10% of total global industrial greenhouse gas emissions.
However, unlike fossil fuels, metals possess an extraordinary environmental attribute: they are infinitely recyclable. Once refined, copper, iron, gold, and aluminum can be melted down and re-engineered indefinitely without any loss of physical or chemical properties. Secondary copper recycling requires 85% less energy than primary mining; recycled aluminum requires 95% less energy than smelting virgin bauxite ore. Developing closed-loop recycling infrastructure for electronics, electric vehicles, and structural metals is the single most effective strategy to relieve extraction pressure on natural ecosystems.
To explore comprehensive mineral profiles and official extraction data for countries around the globe, visit our Natural Resources by Country directory.
Authoritative Data Sources Used
All mineral production volumes, reserve figures, and technical definitions in this article are derived from primary official records:
- United States Geological Survey (USGS): Mineral Commodity Summaries (Annual) and Mineral Resources Program.
- International Energy Agency (IEA): Critical Minerals Market Review.
- British Geological Survey (BGS): World Mineral Statistics Database.
- Committee for Mineral Reserves International Reporting Standards (CRIRSCO): International reporting definitions for exploration results, mineral resources, and mineral reserves.
- To review our editorial verification protocols, see our Research Methodology and Official Sources.

Leave a Reply